
User guide

504
pmp-0229 (Mar 2013)
Interpreting Messages in the Event Log (All) Using Informational Tabs in the GUI
Interpreting Messages in the Event Log (All)
Each line in the Event Log of a module Home page begins with a time and date stamp. However,
some of these lines wrap as a combined result of window width, browser preferences, and line
length. You may find this tab easiest to use if you widen the window until all lines are shown as
beginning with the time and date stamp.
Time and Date Stamp
The time and date stamp reflect either
• GPS time and date directly or indirectly received from the CMM.
• the running time and date that you have set in the Time & Date web page.
NOTE:
In the Time & Date web page, if you have left any time field or date field unset
and clicked the Set Time and Date button, then the time and date default to
00:00:00 UT : 01/01/00.
A reboot causes the preset time to pause or, in some cases, to run in reverse.
Additionally, a power cycle resets the running time and date to the default
00:00:00 UT : 01/01/00. Thus, whenever either a reboot or a power cycle has
occurred, you should reset the time and date in the Time & Date web page of
any module that is not set to receive sync.
Event Log Data Collection
The collection of event data continues through reboots and power cycles. When the buffer
allowance for event log data is reached, the system adds new data into the log and discards an
identical amount of the oldest data.
Each line that contains the expression WatchDog flags an event that was both
• considered by the system software to have been an exception
• recorded in the preceding line.
Conversely, a Fatal Error() message flags an event that is recorded in the next line. Some
exceptions and fatal errors may be significant and require either operator action or technical
support.
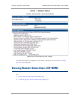
An example portion of Event Log data is displayed in Figure 159. In this figure (unlike in the
Event Log web page)
• lines are alternately highlighted to show the varying length of wrapped lines.