
User guide


422
pmp-0229 (Mar 2013)
Monitoring the RF Environment Growing Your Network
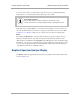
Figure 146: Spectrum Analyzer tab of SM, example
Colors in the display have the following meanings:
• Green bars show the most recent measurements.
• Yellow ticks show the maximum measurements from the current spectrum analysis session.
• Red ticks show measurements of −40 dBm or stronger.
To keep the displayed data current, either set “Auto Refresh” on the module’s Configuration =>
General page to a few seconds, or repeatedly click the Enable button. When you are finished
analyzing the spectrum, click the Disable button to return the module to normal operation.
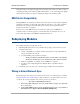
Using the AP as a Spectrum Analyzer
You can temporarily change an AP into an SM and thereby use the spectrum analyzer
functionality. This is the only purpose supported for the transformation.