
User guide


Canopy System User Guide Monitoring the RF Environment
pmp-0229 (Mar 2013)
421
You can use any module to see the frequency and power level of any detectable signal that is
within, just above, or just below the frequency band range of the module.
RECOMMENDATION:
Vary the days and times when you analyze the spectrum in an area.
The RF environment can change throughout the day or throughout the week.
Temporarily deploy an SM or BHS for each frequency band range that you need to monitor and
access the Spectrum Analyzer tab in the Tools web page of the module. (For access from a PDA,
see PDA Access to Modules on Page 385.) To enter the scan mode and view readings, click
Enable.
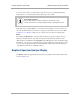
After clicking the Enable button on the Spectrum Analyzer page, the first “painting” may not
display bars for all frequencies, especially on frequency bands with a large number of center
channels, like the 5.4 GHz band. Clicking Enable again will display the entire spectrum bar graph.
Alternatively, you can set the “Auto Refresh” time on the Configuration => General page to a few
seconds to have the Spectrum Analyzer automatically fully displayed and refreshed. (Setting the
“Auto Refresh” time back to 0 will disable refresh.)
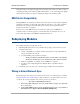
Graphical Spectrum Analyzer Display
An SM/BHS displays the graphical spectrum analyzer. An example of the Spectrum Analyzer tab
is shown in Figure 146.