
User guide


Analyzing the RF Environment Engineering Your RF Communications
126
pmp-0229 (Mar 2013)
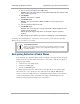
3. Access the Tools web page of the SM or BHS.
RESULT: The Tools page opens to its Spectrum Analyzer tab. An example of this
tab is shown in Figure 146.
4. Click Enable.
RESULT: The feature is enabled.
5. Click Enable again.
RESULT: The system measures RSSI and dBm for each frequency in the
spectrum.
6. Travel to another location in the area.
7. Click Enable again.
RESULT: The system provides a new measurement of RSSI and dBm for each
frequency in the spectrum.
NOTE: Spectrum analysis mode times out 15 minutes after the mode was
invoked.
8. Repeat Steps 6 and 7 until the area has been adequately scanned and logged.
As with any other data that pertains to your business, a decision today to put the data into a retrievable
database may grow in value to you over time.
RECOMMENDATION:
Wherever you find the measured noise level is greater than the sensitivity of the radio
that you plan to deploy, use the noise level (rather than the link budget) for your link
feasibility calculations.
Anticipating Reflection of Radio Waves
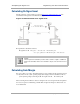
In the signal path, any object that is larger than the wavelength of the signal can reflect the signal.
Such an object can even be the surface of the earth or of a river, bay, or lake. The wavelength of
the signal is approximately
• 2 inches for 5.2- and 5.7-GHz signals.
• 5 inches for 2.4-GHz signals.
• 12 inches for 900-MHz signals.
A reflected signal can arrive at the antenna of the receiver later than the non-reflected signal
arrives. These two or more signals cause the condition known as multipath. Multipath may
increase or decrease the signal level and so overall attenuation may be higher or lower than that
caused by the link distance. This is problematic at the margin of the link budget, where the
standard operating margin (fade margin) may be compromised.