
User`s guide


PAGE 6
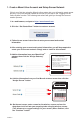
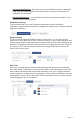
To the left side of each sensor row is an indicator to help you understand the current
status of the sensor.
Sensor is checking in and within user dened safe parameters.
Sensor has met or exceeded a user dened threshold or triggered event.
Sensor has not checked in (inactivity alert sent).
No sensor readings will be recorded (Inactive)
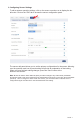
Sensor Details View
Clicking on a sensor row on the “Overview” page expands the row to include a de-
tailed sensor view for the selected sensor.
Select a tab to change between:
History - Displays a history of the selected sensor’s data.
Chart - Displays a graphical view of the selected sensor’s data.
Notications - Allows you to manage notications for the sensor.
Export - Allows you to archive data by exporting as a .csv le.
Edit - Allows you to manage sensor settings.
Calibrate - Available on certain sensor types to provide more accurate data.
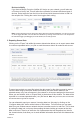
Note: The data shown on the chart, notication, history and export tabs is based on the date
range indicated on the upper right side of the sensor detail information. To change the date
range, click inside the date box.
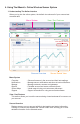
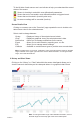
2. History and Chart Views.
Clicking on the “History” or “Chart” tabs within the sensor detail panel allows you to
view the sensor’s data history as time stamped data or in a graphical chart format.
Note: To change the date range of the viewable information, click on
the date range box at the top right of the sensor detail panel.