
Instruction Manual

MicroShockDetector plus
- 25 -
4 . 3 . 7 E v a l u a t i o n o f s h o c k e v e n t s
A MONILOG
®
MicroShockDetector plus registers the 200 largest shock events above the set
threshold values and of these for the 10 largest impacts the curve progression over 4 seconds each.
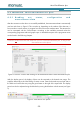
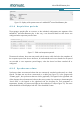
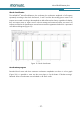
All shock events are listed in a table under the “Shock events” tab. In the “Shock alarm” column,
the exceeding of an alarm threshold is marked with the corresponding direction. The associated
curve can be called up by double-clicking on the table line if the circle symbol • is available in the
“Curve” column.
Figure 15: Shock event table
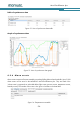
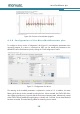
Figure 16: Shock event graph
The shock curves can also be scrolled through using the scroll bar above. By activating or
deactivating the “check mark” in the legend on the right-hand side, the x, y, z-channel and the
amount curve can be shown or hidden (see Figure 16). The dashed vertical lines mark the pulse
selected in the curve period.
With the „→“ or “± 14 g” button, the vertical diagram axis is switched between the maximum
values of the curve and the full measuring range of ± 14 g.
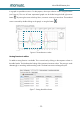
Principle of the shock recording:
The shock recording starts when the value of the acceleration exceeds the internal registration
threshold of 0.25 g on at least one measuring channel (approx. 3% of the measuring range).