
Instruction Manual

MicroShockDetector plus
- 20 -
4.3 M O N I L O G
®
M i c r o S h o c k D e t e c t o r p l u s
4 . 3 . 1 R e a d i n g o u t s t a t u s , c o n f i g u r a t i o n a n d
m e a s u r e m e n t d a t a
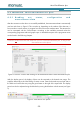
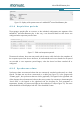
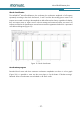
After the connection to the device is successfully established, the measurement data is automatically
read out and shown in Figure 8. This can take up, depending on the number of the data sets, a
few seconds to several minutes. A progress bar shows the current readout status. The transmission
can be interrupted with the Cancel button. According to the available measured values the
corresponding programme tabs and graphs open. A detailed description of the programme areas
can be found in the following chapters.
Please do not disconnect the USB cable from your PC or MicroShockDetector plus, as long as the
data transmission takes place!
Figure 8: Overview window after reading out the measurement data of MicroShockDetector plus
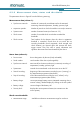
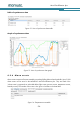
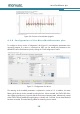
With the display period, the display of data can be restricted to the desired time range. This
simplifies data analysis and the finding of certain events. Enter the desired start and end date in
the fields and confirm the entry using the green button to the right of the input fields. The display
period can also be adjusted using the slide bar by moving the blue bars with the mouse (see Figure
9).
Figure 9: Slide bar for view period