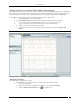
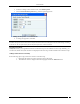
Locations Tab Placing Locations on a Location Folder with an Attached Image The system enables you to place locations on a location folder that has an attached image. This helps you identify the physical position of each of the locations. The locations placed on the attached image are indicated by colored circles. A green circle indicates that the location is Secure, while a red circle indicates that the location is Vulnerable.
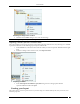
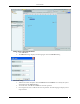
Locations Tab Detaching an Image from a Location 3. Click Yes in the Confirm dialog to remove the selected image. Note: On detaching an image, all the placed locations go back to the Available Locations list. Importing a Planner file into a Location Node The system enables you to specify a layout for each location node using a blank canvas, a layout image, or a .SPM file exported from Planner. Use the following steps to import a Planner file: 1.
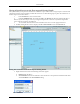
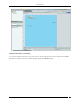
Locations Tab Placing APs and Sensors on the Floor map and Viewing Details The system enables you to place APs and Sensors on the floor map to view live RF coverage maps for a location node and perform on-floor location tracking of visible 802.11 devices. Use the following steps to place APs and Sensors on the floor map and view their details: 1. In the Location tree, select a location node. 2.
Locations Tab Change RF Property: Select RF Property to change the RF properties of the device. In AP RF Properties dialog, select the Interface name from the Interface drop-down list. Enter Transmit Power (mW) and Transmission Calibration Factor (dB). Click Apply and then OK. AP RF Properties dialog In the Sensor RF Properties dialog select the Interface name from the Interface drop-down list. Enter Reception Calibration Factor (dB). Click Apply and then OK.
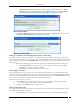
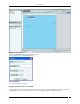
Locations Tab 2. 3. From the resulting context-sensitive menu, select Edit Properties. On the Location Node Properties dialog, edit the required properties. Editing the Properties of a Location Node 4. To change the properties, click Save. Note: If you resize a location node to a smaller dimension, the objects placed on the floor map are drawn beyond the floor boundaries. The system removes all the devices that fall outside the resized area.
Locations Tab Adding Notes to Floor Map Elements 3. 4. Select Add Notes. The Add note dialog is displayed. Following figure shows the Add Note dialog. Add Notes dialog 5. 6. 7. Add the note and its description. The X Coordinate and Y Coordinate are sensed by the System and populated in the Add note dialog. To save the note, click OK. Click Cancel to cancel the operation. On saving the note, note is added to the floor map element. The following figure displays a floor map with notes.
Locations Tab Floor Map with a Location Note Editing Location Notes on a Floor Map You can edit existing location notes at any given point. To do this, right click the note to be edited. Select the Edit note option to edit the location notes. Following figure displays the Edit Note option.
Locations Tab Editing Location Tags On Selecting Edit Note option, Edit Note dialog appears. Following figure displays the Edit Note dialog. Edit Note dialog You can edit all fields in the dialog. Hiding Location Notes shown on a Floor Map You can hide location notes that are visible on a floor map. To do this, right click anywhere on the floor map. Select the Hide notes option to hide all the Location notes. Following figure displays the Hide notes option.
Locations Tab Hiding Location Notes visible on Floor Map Displaying Hidden Location notes shown on a Floor Map You can display hidden location notes on a floor map. To do this, right click anywhere on the floor map. Select the Show notes option to show all the Location notes. Following figure displays the Show notes option.
Locations Tab Show notes on Floor Map Click Show Notes button to display all the notes defined for the floor map. Deleting Location Notes from Floor Map You can delete Location notes that are visible on a floor map. To do this, right click the note/location tag to be deleted. Select the Delete note option to delete the location note. Following figure displays the Delete note option.
Locations Tab Deleting Note from Floor Map The note is deleted from the floor map. Printable View The RF views for the floormap can be saved as printable view in jpg, png, and HTML formats.
Locations Tab Locations Tab – Printable View Icon Note: The Printable View icon is available on the Location nodes and not in the Location folders. Click the Printable View icon and save the printable view as jpg, png, or HTML as shown in the figure.
Locations Tab Saving the Printable view of the RF views Viewing RF Coverage Maps To view a live RF coverage map for a location node, Authorized APs and Sensors must be placed on the floor map. Use the following steps to view live RF coverage maps: 1. Place devices on the floor map using the steps given in the Placing APs and Sensors on the Floor map and Viewing Details section. 2. Select one of the following views. AP Coverage View The AP Coverage View enables you to view an 802.
Locations Tab AP Coverage View AP Channel View The AP Channel View enables you to view all the 802.11 channels available for connection at each point on the floor. It helps in preventing potential channel interference scenarios.
Locations Tab AP Channel View AP Link Speed View The AP Link Speed View enables you to view the maximum downlink rate with which a Client at a particular point can connect to an AP on the floor.
Locations Tab AP Link Speed View Sensor Coverage View The Sensor Coverage View enables you to view the detection and prevention zones of visibility for selected Sensors.
Locations Tab Sensor Coverage View Detection Range is the area over which Sensors can reliably detect wireless activity of devices operating at a power level greater than the value set in the Transmit Power slider. The Intrusion Detection Display Threshold determines the threshold for this range. Prevention Range is the area over which Sensors can prevent unauthorized wireless activity. The Intrusion Prevention Display Threshold determines the threshold for this range.
Locations Tab 3. Change the values of the Signal Decay Slope (Beta) and the Signal Decay Inflection (Alpha). The system uses these parameters when computing the RF and defines the region around the transmitter that is unobstructed. Note: When you change the Min. Signal Decay Constant, Max. Signal Decay Constant, Signal Decay Slope (Beta), and Signal Decay Inflection (Alpha) the RF view and location tracking for unobstructed regions is affected.
Reports Tab Reports Tab Reports: Panel for Generating Reports The Reports screen enables you to generate predefined and customized reports. The system uses a query-based mechanism to generate various reports. The system provides predefined compliance reports: Health Insurance Portability and Accountability Act (HIPAA), Sarbanes-Oxley (SOX), Gramm-Leach-Bliley (GLBA), Payment Card Industry (PCI) Standard, and so on.
Reports Tab Shared Reports: Contains reports that all the users can view and schedule. These include Assessment Reports, Compliance Reports, Incident Reports, Device Inventory Reports, Performance Reports, SAFE Client Reports, and Custom Reports. My Reports: Contains reports available only to those users who have generated them. These are custom reports. You can import a custom report by clicking Import Report.You can import a report created in SpectraGuard Enterprise.
Reports Tab List of Sections The List of Sections table displays sections created for a selected report.
Reports Tab Archived Reports Tab User Name: Displays the name of the user who generated the report. Location: Displays the name of the location at which the report is generated. If the Location tree is updated after a report is generated, this field is not updated. Report Name: Displays the name of the report that appears at the time of report generation. Updating the report name does not update the name here. Format: Specifies the format of the report; that is HTML, XML, or PDF.
Reports Tab 2. Under List of Reports, click Add Report. Report Details Screen showing Report Header Tab 3. On the Report Details dialog, under Report Name, enter a unique, user-friendly name for the report. 4. Under Report Description, enter brief note to help identify the report. 5. Click Use default look and feel, to retain the default text, title, and colors for the reports. 6. Alternatively, click Customize look and feel, to customize the appearance of the report. 7. Select the Report Header tab. 8.
Reports Tab Location for which the report is generated User who generated the report Date and time when the report is generated Select the checkbox, Display Report Description Text to view a detailed description of the report. 10. Select the Report Summary tab. Report Details Screen showing Report Summary Tab Clear the checkbox, Display Report Summary if you do not wish to view the Report Summary in a tabular form.
Reports Tab Under Summary Table Column Header Definition, select the checkbox, Display Report Summary Table to customize the following column names in the Report Summary table in the generated report. Section Name Section Description Query Type Result Count Jump to Under Summary Charts, select an option button to view the charts in the desired format. 11. Select the Report Sections tab.
Reports Tab Select Display Section Description text to view a brief description for each section of the report. Select Display Section Query to view all the constraints specified in the database query for that section. 11. To add the report to the List of Reports, click Save. The new report appears under the List of Reports table. Editing a Report The system enables you to edit user-defined reports. You cannot edit pre-defined reports.
Reports Tab The system enables you to delete a user-defined report. You cannot delete pre-defined reports or a shared report scheduled by other users. Use the following steps to delete a report: 1. From the List of Reports table, select the report that you want to delete. 2. Click Delete Report. 3. Click Yes on the Confirm dialog to delete the report. Moving a Report The system enables you to move a report from Shared Reports–Custom Reports to My Reports and vice versa.
Reports Tab Adding a Section to a Report 3. 4. 5. 6. 7. 8. 9. On the Add Section to Report dialog, enter a Section Name and a Section Description for the newly added section. Select the checkbox Display this section to view this section in the generated report. Under Section Query Type, select Device, Event, or SAFE as the query type. Select any combination of the AP, Client, and Sensor checkboxes to include these device types in the results. These checkboxes are not available for a SAFE query.
Reports Tab Select the checkbox Table to view a tabulated count for the selected attribute. Note: Pie charts are not visible in an HTML report. You can view pie charts only in a PDF report. Select an attribute and click to delete that attribute. Select an attribute and click or to organize the attributes that appear as columns in the Section Results table of the generated report. 10. To save the section to an existing report, click .
Reports Tab Scheduling a Report for One Time Generation 3. From the Format drop-down list, select the output type for the report, that is, HTML, XML, or PDF. Note: The system does not support PDF report generation on older versions of IE (versions lower than 7.0). 4. Select either One Time Generation or Recurring Generation.
Reports Tab Scheduling a Report for Recurring Generation To schedule a report for Recurring Generation, perform the following: Under Schedule Report, from the Generate Report Every drop-down list select the number of hours, days, or months over which to deliver the report. Click the calendar icon next to Start Date to select the start date and time for the report. Click the calendar icon next to End Date to select the end date and time for the report.
Reports Tab Click Add to open Additional Email Addresses dialog where you can specify a custom email address for a non-system user who will receive a scheduled report. In this dialog, you can add multiple email addresses one at a time. Specifying Additional Email Addresses for Report Delivery 7. 8. 9. Click OK to close the Additional Email Addresses dialog. Click OK to close the Report Delivery dialog. To schedule the report, click Save.
Reports Tab Generating a Report 3. On the Generate Report dialog, select the Report Time Period by doing one of the following: Select the number of days or hours from the drop-down list over which to collect data. Use the calendar icons to the right of the From and To fields to select the start time and end time for which to collect the data. 4. Select the Format in which to generate the report, that is, HTML, XML, or PDF. 5.
Reports Tab Report in PDF Format 8. Alternatively, to save a report in XML format, in the Save dialog, specify the path where you want to save the report. Report in XML Format Sample Report Generation The example given in this section walks you through the process of creating a new report and shows you how to add a new section consisting of several database queries to the report.
Reports Tab Use either Channel 6 or Channel 11 for wireless communication Creating a Report 1. 2. 3. 4. Select the tab My Reports. Add a new report to the List of Reports table by clicking Add Report. On the Report Details dialog, enter a Report Name for the new report (for example, Rogue AP Associations), a Report Description to identify the report, and optionally customize the look and feel of the report. Click Save. The new report appears under the List of Report table. Adding a Section 1. 2. 3.
Reports Tab 2. 3. 4. 5. 6. Click Generate. The Generate Report dialog appears. Under Report Time Period, select 7 days. Under Format, select PDF. Under Report Archival, select Archive Report and then select Delete after 360 days to retain the archived report for 360 days. Click OK. The PDF report opens in a different browser window. Report in PDF format for ‘Rogue AP Associations’ 7.
Reports Tab Report for ‘Rogue AP Associations’ showing Section Summary SpectraGuard® Enterprise User Guide 157
Reports Tab Report for ‘Rogue AP Associations’ showing Section Results SpectraGuard® Enterprise User Guide 158
Forensics Tab Forensics Tab Forensics: Panel for Threat Forensics The Forensics screen enables you to drill down into forensic data about wireless threats detected in the network. The system captures important details about the detected threats and presents them in a human-readable format. You can review details such as device identities and configurations, connection records, device locations, system responses, and administrator actions about the detected wireless threats using this tab.
Forensics Tab You can view the threats based on the Time Filter, do one of the following: Select Time Period and select Last 4 Hours, Last 12 Hours, Last 24 Hours, or Last 48 Hours from the dropdown list. Select From click the icon to specify a start date and time. Under To, click the icon to specify an end date and time and then click Apply.
Forensics Tab Threats List Primary Device: Specifies the category of the threat (AP or Client) based on the primary device involved/effected by the threat. Threat: Specifies the actual name of the threat type (such as Rogue AP, Honeypot AP, Ad hoc Networks , and so on). Instances: Specifies the number of threats of the respective type in the given time frame. Devices: Specifies the number of unique Primary Devices which were involved in this threat type.
Forensics Tab Forensics Details Dialog The various fields and buttons in the Forensics Details dialog are: Short Description: Provides a brief description of the selected AP/Client threat. This is presented as bold text at the top of the dialog. All Devices Filter: Displays unique list of all the Primary Devices which where involved in the threat in the time frame selected in the Time Filter in the Threats List screen. Click the All Devices Filter icon, the Device Filter dialog opens.
Forensics Tab Event End Time: Displays the event end time. If the event is live, the Event End Time is Ongoing. Refer to AP Based Threats section or Client Based Threats section for more details about Association, Prevention, and Admin tabs depending on the threat type. AP Based Threats The AP Based Threats Details dialog gives information about the AP based threat, which helps you determine the actions taken after the threat was detected.
Forensics Tab View. Click Floor Map View to view the location of the selected device at the selected time in the Floor Map View. Location dialog Note: The first row in the AP based threat displays the Event Time, while rest of the rows displays the Start/End Time of Association. This is valid for all AP based threats, except DoS. AP Based Threat – Prevention Tab Prevention Tab shows the details of the Quarantine status of the association in the Association tab.
Forensics Tab AP Based Threat Details – Prevention Tab The fields in Prevention Tab are as follows: AP Client Association Start Time Association End Time Quarantine: Specifies the action taken on both the devices in the association. Even one of device is quarantined, the association is Quarantined, otherwise it is Not Quarantined. Click Quarantined, the Quarantine Details dialog opens. Quarantine Details dialog Click Not Quarantined, the Not Quarantined Reason dialog opens.
Forensics Tab Not Quarantined Reason AP Based Threat – Admin Tab Admin Tab shows all the administrator actions taken on the AP between the Event Start Time and Event End Time.
Forensics Tab The fields in Admin Tab are as follows: User: Specifies the name of the user who took action on the threat. Action: Specifies the action taken by the user for the AP based threat such as AP added to quarantine, AP name changed Time: Specifies the time when the user action was taken Note: All the above tabs Association, Prevention, and Admin shows the information based on the Device and Event selected in the Threats List dialog.
Forensics Tab Association Start Time Association End Time Locate Click Locate, the Location dialog opens. In case of Unicast, select the AP/Client/DoS Attacker participating in the event from Locate Device drop down list. Incase of Broadcast, select the AP/DoS Attacker participating in the event from Locate Device drop down list. Select Start Time of Association and End Time of Association from At drop down list. Click Locate the location of the selected device at the selected time is displayed.
Forensics Tab AP – DoS Threat Details – Admin tab The fields in Admin tab are as follows: User Action Time Client Based Threats The Client Based Threats Details dialog gives information about the Client based threat, which helps you determine the actions taken after the threat was detected. To open the Client Based Threat Details dialog, select a Client Threat row on the Forensics scree,n and click Details.
Forensics Tab Client Based Threat Details dialog Client Based Threat – Association Tab Association Tab shows the number of connection attempts that where made to the Client selected for the duration of the selected Event. The fields in Association Tab are as follows: Client: In case of Client based threats, Client is the Primary Device. Click Client, the Client Details dialog opens. AP: AP is the device which is associated to the Primary Device. Click AP, the AP Details dialog opens.