
User Manual Part 2

Devices Tab
SpectraGuard® Enterprise User Guide
98
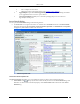
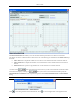
Sensor Spectrum Tab
On the Devices screen, right-click a Sensor row and then select the Details menu item. Select the Spectrum tab to
view the Spectrogram, or Channel Crowding details. Spectrogram is a graphical representation of the interference for
the selected radio and time frame. At a given point in time, either the Spectrogram or the Channel Crowding is seen
in this tab. By default you will see the Channel Crowding in this tab.
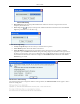
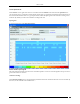
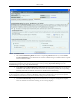
Spectrogram
To see the Spectrogram, click Show Spectrogram.
Sensor Details- Spectrogram
Select the radio band and the time interval for which the impedance is to be viewed. The legend for the power ratio is
given at the bottom for reference.
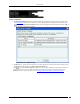
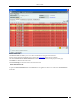
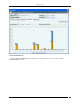
Channel Crowding
Click Channel Crowding to view the graphical representation of the APs and clients detected on various channels by
the sensor, for the selected radio and time frame.