
User Manual Part 2

Devices Tab
SpectraGuard® Enterprise User Guide
97
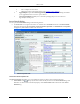
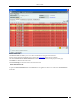
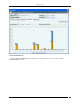
Sensor Performance Tab
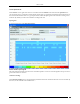
The Sensor Performance tab enables you to view the data related to performance of a Sensor in chart form.
Line Charts are shown on the Performance Tab. Choose one of the Chart types available from the Select Chart drop-
down list:
Active APs: Sensor samples the number of active APs on each channel at the end of each time interval.
Active Clients:Sensor samples the number of associated Clients on each channel at the end of each time
interval.
Interference:Sensor reports average interference on each channel over each time interval.
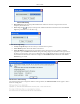
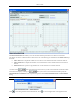
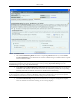
A button such as next to the chart type selection shows you the current channel and channel width
used in the chart display. Clicking on allows you to select a new channel and width. Specify the
Channel Number and Width from the respective drop-downs in the Sensor Performance Tab – Select Channel
dialog.
Note: Width is enabled only for 11n Sensors.
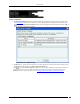
Sensor Performance Tab – Select Channel
Click to view enlarged Chart on the left hand side. Click to view enlarged Chart on the right hand side