
User Manual Part 2

Devices Tab
SpectraGuard® Enterprise User Guide
75
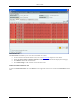
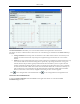
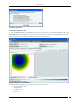
Client Performance Tab
The Client Performance tab enables you to view the data related to Client performance in chart form.
Line Charts are shown on the Performance Tab. Choose one of the Chart types available from the Select Chart drop-
down list:
Average Data Rate: Sensor keeps track of transmission rates of data frames in Client’s associations (across
multiple associations if that is the case) and reports weighted average transmission rate over each time
interval.
Traffic: Sensor reports data traffic sent and received by Client (across multiple associations if that is the case)
over each time interval. The channel-rotating Sensor spends only a percentage of total time on any given
channel; therefore this parameter typically underestimates the actual traffic by a factor equal to the total
number of channels scanned by the Sensor radio. For example, if b/g radio on the Sensor scans 11 channels
in all, the measured traffic will be about 1/11th of the actual traffic if the traffic is continuous. Similarly, if a
radio on the Sensor scans 30 channels in all, the measured traffic will be about 1/30th of the actual traffic.
However, if the traffic comes in bursts, straightforward scaling as above cannot be applied.
Click to view enlarged Chart on the left hand side. Click to view enlarged Chart on the right hand side.
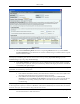
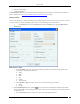
Fields in the Client Troubleshoot Tab
To open the Client Troubleshoot tab on the Devices screen right-click a Client row and select the Start
Troubleshooting menu item.