Devices Tab If a Sensor is available, the system automatically selects a defending Sensor for an Authorized AP. The Quarantine status of the AP then appears as Quarantined. If a Sensor is not currently available, the Quarantine status of the AP appears as Quarantine Pending. As soon as a Sensor is available, it starts defending the AP. The AP may appear as Quarantine Pending if it is not currently an active threat (the AP is inactive).
Devices Tab Merged AP Context-Sensitive Menu for the BSSIDs of the Merged APs AP Details Dialog To open AP Details dialog, right-click an AP row on the Devices screen, and select the Details menu item. The AP Details dialog has the following tabs: Properties, Events, Performance, Troubleshoot, and Locate. The Properties tab is displayed by default.
Devices Tab AP Properties Tab Fields in the AP Properties Tab The AP Properties tab enables you to view and edit the properties of an AP. MAC/Protocol: Select the MAC/Protocol from the drop-down list to display the relevant information of the selected BSSID. MAC/Protocol field appears only for merged APs. The Primary BSSID of the AP is shown in bold. AP Name: Click and specify the name used to identify the AP in the AP Name dialog. Click Save.
Devices Tab AP Classification Dialog Device Tag: Click to specify text that provides additional information about the AP in the Device Tag dialog; for example, Hawaii Conference Room, Bldg 15 – Cubicle G2, or Executive Area. Click Save to save the device tag. AP Device Tag Dialog MAC Address: Specifies the unique 48-bit address of the AP/ 802.11 PHY modes used by the AP. MULTIPLE displays, if For All BSSIDs is selected in the MAC/Protocol field.
Devices Tab AP IP Address Dialog Basic Link Rates (Mbps): Displays a comma separated list of link rates supported by the AP. Vendor: Specifies the name of the AP manufacturer, which is inferred from the first three bytes of the MAC address. SSID: Specifies the unique identity that prospective Clients use to recognize the network. MULTIPLE is displayed, if For All BSSIDs is selected in the MAC/Protocol field. Is Guest SSID?: Indicates if the SSID is a guest SSID.
Devices Tab Note: Quarantine Status, Defending Sensor, Port Block Status, and Port Block Details fields are not visible if WIDS license is applied. Note: If the selected AP is currently quarantined, a Remove from Quarantine button appears in the AP Properties dialog. Click to view an Information message and to enable wireless communication to the AP.
Devices Tab BPSK, QPSK, 64-QAM), coding rate (for example, 1/2, 3/4), guard interval (800 or 400 ns), and number of spatial streams. Support for MCS 0-15 is mandatory for 802.11n APs and support for MCS 0-7 is mandatory for 802.11n Clients. Greenfield Mode: Indicates if the AP is capable of working in the Greenfield mode. Greenfield mode is an optional high-throughput mode in the 802.11n standard, which is not backward compatible with legacy (802.
Devices Tab AP Events Tab The AP Events tab enables you to view the events where the AP is participating device. MAC/Protocol: Select the MAC/Protocol from the drop-down list and the relevant events of the selected BSSID is displayed. MAC/Protocol field appears only for merged APs. For the columns in the Events details screen, refer to the Events Tab chapter for more details. Check the Click to select or deselect all Events checkbox to select all the Events displayed on that page.
Devices Tab AP Performance Tab Note: In the Performance tab, data is only available for Authorized devices. The AP Performance tab enables you to view the data related to performance of an AP in chart form. MAC/Protocol: Select the MAC/Protocol from the drop-down list and the relevant performance information of the selected BSSID is displayed. MAC/Protocol field appears only for merged APs. Line Charts are shown on the Performance Tab.
Devices Tab The system provides Knowledge–based Troubleshooting (KBT) which enables you to precisely identify the cause of common problems in your wireless network. KBT uses a knowledge base of wireless problem symptoms and their root causes. The knowledge base is derived from extensive experimentation with WLANs.
Devices Tab 3. Under Protocol and Channel Selection: The Protocol and Channel on which the AP is operating automatically selects by default. For Merged APs in the MAC/Protocol field, For all BSSIDs automatically selects by default. A message is displayed that “Please select BSSID to troubleshoot”. Select a BSSID from the MAC/Protocol field’s drop-down list to initiate troubleshooting. Note: A Configuration template is assigned to each Sensor.
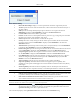
Devices Tab System unable to Launch Wireshark Dialog 8. On the Error dialog, there are three possibilities: You can download and install Wireshark and optionally install WinPcap. Wireshark requires a compatible version of WinPcap. If the installed version and expected version mismatch, you need to install the suggested and expected version of WinPcap. If the system does not find Wireshark installed at the default location, ‘C:\Program Files\Wireshark’, Wireshark will not launch automatically.
Devices Tab Launching OmniPeek Points to note during Troubleshooting When a troubleshooting session is in progress, a blinking icon appears on the navigation bar.
Devices Tab AP Locate Tab – Floor Map view The AP Locate tab enables you to view the following details of an AP. Monitoring Device Filter:Click the Monitoring Device Filter icon and apply the appropriate filters. Image Opacity: Displays the percentage opacity of the image Location Name: Displays the name of the selected location. Total Area: Displays the total area of the selected location.
Devices Tab Filter Devices – AP 2. 3. 4. 5. 6. 7. 8. Under Text Filter, select one or more of the following check boxes and enter the appropriate values manually for searching data related to it: Name MAC SSID Network Vendor Select the Device Type check box, select one or more of the following check boxes: Active Inactive Select First Detected check box, click the icon to specify the first detected date and time of the AP and then click .
Devices Tab 9. WPA Cisco MFP WEP Open Unknown To save and apply the AP filtering criteria, click OK. When the filter is applied it is denoted by Filter On on the Console, if no filter is applied it is denoted by Filter Off on the Console. Client Context-Sensitive Menu A Client is a laptop, a handheld device, or any other system that uses the 802.11 wireless medium for communication.
Devices Tab Client Context-Sensitive Menu on Devices Screen Items in the Client Context-Sensitive Menu The Client context-sensitive menus include the following items.
Devices Tab Remove from Quarantine: Available only if the Client is manually Quarantined this option enables you to stop quarantine on the Client, thereby enabling wireless communication. Enable Auto-quarantine: Enabled by default, this option ensures that the system automatically quarantines a Client, thereby honoring the specified Intrusion Prevention policy.
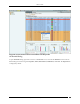
Devices Tab Client Properties Tab Fields in the Client Properties Tab The Client Properties tab enables you to view and edit the properties of a Client. Under Client Properties, you can modify the following: Client Name: Client name field displays the name of the client, derived from the MAC address, by default. Host name of the client is displayed, if it is available to the system. Click and specify the name used to identify the Client in the Client Name dialog. Click .
Devices Tab Click to open the Client Classification dialog. Here, you can change the Client classification to Authorized, Rogue, Guest, or External. Click to move the Client to the selected folder. The changed Client classification automatically displays in the Classification field in the header of Client Details dialog. Client Classification Dialog Device Tag: Click to open the Device Tag dialog. Specify text that provides additional information about the Client.
Devices Tab Placed on Floormap?: Indicates if the Client is placed on the floor map. Currently Active?: Indicates if the Client is currently active. Up/Down Since: Specifies the time since the Client is up/down. Mode of Operation: Specifies whether the Client is connected to an AP (Infrastructure mode) or to a peer-to-peer network (Ad hoc mode). Ad hoc Cell ID: Specifies the unique ID of the ad hoc network connection of which the selected Client is a member.
Devices Tab that device are displayed in the rows. To view details of a specific Device seeing the current Client, click Name, and a new Client Details or Sensor Details dialog appears. Note: Total gives the total number of devices seeing the Client. Recently Associated APs/Ad hoc Networks Section Under Recently Associated APs/Ad hoc Networks, you can view a list of APs/Ad hoc networks to which the Client was associated to.
Devices Tab Ad hoc Client Client Client Client Client Client Client Client Client Client Client Client Client Client Client Client Client Client is is is is is is is is is is is is is is is is is is External and AP is Authorized External and AP is Potentially Authorized External and AP is Guest External and AP is External External and AP is Potentially External External and AP is Rogue External and AP is Potentially Rogue External and AP is Indeterminate Uncategorized and AP is Authorized Uncategorized
Devices Tab Client Events Tab The Client Events tab enables you to view the events details of a Client For the columns in the Events details screen, refer to the Events Tab chapter for more details. Check the Click to select or deselect all Events checkbox to select all the Events displayed on that page. Click Delete to delete the selected events. Click Acknowledge to add comments for the selected events.
Devices Tab Client Performance Tab The Client Performance tab enables you to view the data related to Client performance in chart form. Line Charts are shown on the Performance Tab. Choose one of the Chart types available from the Select Chart dropdown list: Average Data Rate: Sensor keeps track of transmission rates of data frames in Client’s associations (across multiple associations if that is the case) and reports weighted average transmission rate over each time interval.
Devices Tab Packet Level Troubleshooting for an Client 1. Select the Troubleshooting Mode and set the corresponding Timeout interval. If you select Packet Level Troubleshooting, ensure that the Sensor used for troubleshooting is reachable from the computer used to launch the Console. Note: A troubleshooting session automatically times out or terminates after the Timeout irrespective of the activity.
Devices Tab 5. Click to begin the session. If the Sensor is assigned a Configuration template, where no channels are selected for scanning, an error message displays. Packet Level Troubleshooting Confirm Dialog 6. 7. On the Confirm dialog, you may have two or three packet capture tool options, depending on the licensing agreement with AirTight Inc. Select a packet capture tool.
Devices Tab System unable to Launch Wireshark Dialog 8. On the Error dialog, there are three possibilities: You can download and install Wireshark and optionally install WinPcap. Wireshark requires a compatible version of WinPcap. If the installed version and expected version mismatch, you need to install the suggested and expected version of WinPcap. If the system does not find Wireshark installed at the default location, ‘C:\Program Files\Wireshark’, Wireshark is not launched automatically.
Devices Tab Launching OmniPeek Fields in the Client Locate Tab To open the Client Locate tab, on the Devices screen, right-click a Client row and select the Locate menu item. The Floor Map View of a Client displays the location of the Locating Device which shows the probable location of the Client on the floor map, if the Sensor monitoring the Client is on the floor map. Client Locate Tab – Floor Map View The Client Locate tab enables you to view the following details of a Client.
Devices Tab Device Location Region Location Probability Click Thermometer View to view the distance from Locating Device in feet/meter from the Sensor(s) to which the Client is visible. Refer to Locating an AP/Client placed on the Floor Map for details. Filtering in Clients To focus your attention to a subset of Clients based on a filtering criteria (such as device type, or protocol, and so on) system provides you with the capability to filter Clients. Use the following steps to filter Clients: 1.
Devices Tab a b/g 11n 6. Select the Quarantine check box, select one or more of the following check boxes: Active Pending Stopped 7. Select the SAFE Status check box, select one or more of the following check boxes: Active Not Installed Inactive 8. Select the SAFE Risk Status check box, select one or more of the following check boxes: High Medium Low 9. Select the Operating Mode check box, select one or more of the following check boxes: Infrastructure Ad hoc 10.
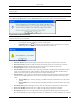
Devices Tab Tagging an Authorized Client as a Smart Device The following figure shows the approved smart device. An approved smart device is indicated by the SpectraGuard® Enterprise User Guide icon.
Devices Tab Approved smart device Tagging an authorized client as an unapproved smart device Under Devices->Clients-> Categorized->Authorized tab, click the client row to be tagged as an unapproved smart device. Right-click this row and click the Smart Device->Unapproved option to tag the client as an unapproved smart device. To tag multiple clients at the same time, hold down the key and click the desired rows one by one.
Devices Tab Tagging a Client as Unapproved Smart Device The following figure shows the unapproved smart device.
Devices Tab Unapproved smart device An unapproved smart device is indicated by the icon. Removing the smart device tag for authorized clients Under Devices->Clients-> Categorized->Authorized tab, click the smart device (client) row to be untagged. Rightclick this row and click the Smart Device->Not a Smart Device option to remove the smart device tag from the client device. To tag multiple clients at the same time, hold down the key and click the desired rows one by one.
Devices Tab Remove the smart device tag Manually Tagging Guest clients as Smart Devices You can manually tag one or more guest clients as smart devices, if they have not already been detected as smart devices automatically. Under Devices ->Clients-> Categorized->Guest tab, click the client row to be selected. Rightclick this row and click the Is a Smart Device option to tag the client as a smart device.
Devices Tab Tagging a Guest Client as a smart device Removing the smart device tag from guest clients You can manually remove the smart device tag from a guest client. Follow the steps given below. 1. Under Devices->Clients->Categorized->Guest, click to select the client row. 2. Right-click this row and select Smart Device->Not a Smart Device to remove the smart device tag.
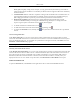
Devices Tab Untagging a smart device Changing the smart device type You can change the smart device type of authorized and guest clients. To change the smart device type, select the authorized client or the guest client row, right-click and select Smart Device->Change Device Type. Here, you can select from the list of available smart devices or directly type in a new smart device type as shown in the figures below, and click OK.
Devices Tab Change smart device type - Add a new device type Note: To delete a smart device type added from Select Type of Smart Device dialog, go to Administration->Global-Device Settings->Smart Device Type. Sensor Context-Sensitive Menu Sensors proactively scan the network and generate events. Sensors communicate event information to the system. Sensors monitor various channels in which the 802.11 devices operate.
Devices Tab Sensor Context-Sensitive Menu Items in the Sensor Context-Sensitive Menu The Sensor context-sensitive menu includes the following items.
Devices Tab View a complete list of locations Change the location of the selected Sensor (see Manual Location Tagging) Upgrade/Repair: Opens the Confirm Upgrade/Repair of Sensor(s) to Build X dialog that enables you to upgrade the Sensor version or repair a Sensor. Cancel Upgrade/Repair: Enables you to cancel the repair/upgrade process for a Sensor in Upgrade/Repair Pending state.
Devices Tab Sensor Name Dialog MAC Address: Specifies the unique 48-bit IEEE format address of the Sensor assigned to the network adapter by the manufacturer. Device Tag: Click to specify text that provides additional information about the Sensor in the Device Tag dialog. Click Save to save the device tag. Sensor Device Tag Dialog Country of Operation: Specifies the country in which the Sensor operates. Sensor Model: Specifies the model number of the Sensor.
Devices Tab Sensor Config Shell Configuration Template: Shows the current configuration template assigned to the Sensor. Refer to the Device Template section for more details. In order to change the Sensor Configuration Template, Click to open the Select Sensor Template dialog. Select the appropriate Sensor template and click to assign that Sensor template to the Sensor. Select Sensor Template Dialog Location: Shows you the name of the Sensor’s location.
Devices Tab Sensor Location Tag Dialog You cannot change the location of a Sensor placed on a floor map. If you attempt to do so, an error message appears. A Sensor placed on a floor map is automatically assigned the location tag of that location. To change the location tag, you must first delete the Sensor from the floor map. Placed on Floormap?: Indicates if the Sensor is placed on the floor map. Currently Active?: Indicates if the Sensor is currently active.
Devices Tab To refresh the Sensor Details screen manually click . The system does not auto refresh after a pre-defined interval. Visible Clients Section Under the Visible Clients Section, you can view a list of Clients that the selected Sensor can see. Client details such as Name and RSSI received by the Sensor are displayed in the rows. To view details of a specific Client, click Name the Client Details screen opens. Note: Total gives the total number of visible Clients that the selected Sensor can see.
Devices Tab Sensor Events Tab The Sensor Events tab enables you to view the event details involving the selected Sensor. For the columns in the Events details screen, refer to the Events Tab chapter for more details. Check the Click to select or deselect all Events checkbox to select all the Events displayed on that page. Click Delete to delete the selected events. Click Acknowledge to add comments for the selected events.
Devices Tab Sensor Performance Tab The Sensor Performance tab enables you to view the data related to performance of a Sensor in chart form. Line Charts are shown on the Performance Tab. Choose one of the Chart types available from the Select Chart dropdown list: Active APs: Sensor samples the number of active APs on each channel at the end of each time interval. Active Clients:Sensor samples the number of associated Clients on each channel at the end of each time interval.
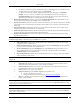
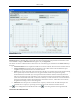
Devices Tab Sensor Spectrum Tab On the Devices screen, right-click a Sensor row and then select the Details menu item. Select the Spectrum tab to view the Spectrogram, or Channel Crowding details. Spectrogram is a graphical representation of the interference for the selected radio and time frame. At a given point in time, either the Spectrogram or the Channel Crowding is seen in this tab. By default you will see the Channel Crowding in this tab. Spectrogram To see the Spectrogram, click Show Spectrogram.
Devices Tab Sensor Troubleshoot Tab To open the Sensor Troubleshoot tab on the Devices screen right-click a Sensor row and select the Start Troubleshooting menu item.
Devices Tab Sensor Troubleshoot tab 1. Select the Troubleshooting Mode and set the corresponding Timeout interval. If you select Packet Level Troubleshooting, ensure that the Sensor used for troubleshooting is reachable from the computer used to launch the Console. Note: A troubleshooting session automatically times out or terminates after the Timeout irrespective of the activity.
Devices Tab Packet Level Troubleshooting Confirm Dialog 4. On the Confirm dialog, you may have two or three packet capture tool options, depending on the licensing agreement with AirTight Inc. Select a packet capture tool. If you have a product license that has OmniPeek support, you have three packet capture tool options – Wireshark, OmniPeek, and ‘Other’. If you have a product license that does not have OmniPeek support, you have two packet capture tool options – Wireshark and ‘Other’.
Devices Tab System unable to Launch Wireshark Dialog 6. On the Error dialog, there are three possibilities: You can download and install Wireshark and optionally install WinPcap. Wireshark requires a compatible version of WinPcap. If the installed version and expected version mismatch, you need to install the suggested and expected version of WinPcap. If the system does not find Wireshark installed at the default location, ‘C:\Program Files\Wireshark’, Wireshark is not launched automatically.
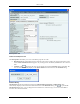
Devices Tab Launching OmniPeek Filtering in Sensors To focus your attention to a subset of Sensors based on a filtering criteria (such as device type, up/down since, and so on) system provides you with the capability to filter Sensors. Use the following steps to filter Sensors: 1. On the Devices screen, click the Sensor tab and click the Filter icon to open the Filter Devices Sensors dialog. Filter Devices – Sensors 2. 3.
Devices Tab 4. 5. 6. 7. Inactive Select the Up/Down Since check box, click the icon to specify the up/down since date and time of the Sensor and then click OK. The search displays the Sensors, which were first detected by the system after the date as specified above. Select the Operating Mode check box, select one or more of the following check boxes: Sensor ND Sensor/AP Combo Under Sensor Template, select the template name from the drop down box for searching data related to it.
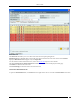
Devices Tab Network Details – APs All APs associated with the network, and with the location including the sub locations under that location, are seen in APs tab under Network Details. Fields in Network Details are as follows: Network Name: specifies the network name Allowed SSIDs: : This is the list of SSIDs allowed (from SSID templates) on this network at or below the location of this network. Gateway MAC: specifies the gateway MAC address. Network: specifies the IP address of the network.
Devices Tab Network Details – Sensors The fields in the Sensors tab are the same as seen in Devices->Sensors tab. You can select the fields that you want to view by clicking the icon. You can view the Sensor details dialog by double clicking any sensor row. Note: Only currently active sensors in the network are seen in the Sensors tab under Network Details. Changing the location of a network Location of a network is same as location of the Sensor that reported the network first.
Devices Tab Changing the network location Click the Change location menu item. The following screen appears on clicking Change Location. Select the new location Select the new location and click OK to move the network to the new location. To cancel the operation, click Cancel. On selecting a new location, the network is seen under the new location.
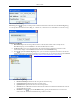
Devices Tab To delete a network from the Networks tab, right click the network row you want to delete. Following figure displays the method to delete network from networks tab. Delete a network Click the Delete option. The following message box is displayed. . Confirm network deletion To delete the selected network, click Yes. To cancel the network deletion, click No. The network will not be deleted if it is being monitored by a sensor.
Devices Tab 3. From the context-sensitive menu, select Locate. A Tracking Location progress bar followed by a Locate tab appears. The Locate tab displays the distance in feet and meter of the selected device from the locating device, which appears in the Thermometer View. Alternatively, if the device for which you are searching is not visible to any Sensor, a message appears.
Devices Tab AP Locate Tab – Floor Map View Note: The Floor Map View appears only if you have placed Authorized APs and Sensors on the Floor Map. The Floor Map View dialog displays color shaded regions around Sensors and APs with colors indicating the probability of the location of the device. It displays Location Probability slider which shows the color coding from low to high probability.
Devices Tab Monitoring Device Filter Dialog Removing a Device from Quarantine The system enables you to remove a device from quarantine so that wireless communication can start on that device. You can remove a device from quarantine in several ways. If the device is automatically quarantined, you can do one of the following: Right-click the device row and select Disable Auto-quarantine. Change the Intrusion Prevention policy that quarantines the device.
Devices Tab Many modern APs have multiple network interfaces and SSIDs on a single device to support 802.11a and 802.11b/g simultaneously. Each interface has a different MAC address, which causes the system to identify them as different APs. The system displays such APs in separate rows on the Console. This may lead to confusion. Merge can be of two types: 1. Automatic: The system performs automatic merge of certain APs based on their MAC addresses or other available information. 2.
Devices Tab The following User choices made during browsing of Devices Tab are saved by the system: Filtering Devices – APs, Clients, and Sensors. Display Columns. Column Width and Column order These settings are saved on log out as well as movement to other tabs on the Console.
Locations Tab Locations Tab Locations: Panel for Creating Locations The Locations screen enables you to organize your network into a list of locations and view live 802.11 RF coverage maps for each location node. On the Locations tab, you can add, delete, and move a location folder or node, import a floor map on a location node, attach or detach an image from a location, place available locations on an attached image, and place devices on the floor map. You can also view live RF maps.
Locations Tab 4 5 6 7 8 9 10 11 12 13 14 15 16 17 18 19 20 21 Search Sort Location Details Ruler Resolution Look for a device or location in the table. Sort devices or locations in ascending/descending order. View the list of locations of a specific location node. View the dimensions of the floor map: in feet. Change the resolution to Low, Medium, or High.
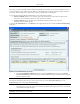
Locations Tab Adding a New Location Specifying Location Properties 3. 4. In the Add New Location dialog, select the type of location, that is, Location Folder or Location Node. Enter a name for the new location and optionally enter the following details. Select Image File: Click Browse to navigate to the path of the image that you wish to attach to the location folder or node. You can attach the image later as explained in the Attaching an Image section.
Locations Tab Moving a Location The system enables you to move a location to a different location folder. Use the following steps to move a location to a specific folder: 1. In the Location tree, select the location that you wish to move. 2. Right-click and from the resulting context-sensitive menu, select Move. Moving a Location Selecting a Destination Location 3. In the Location Move dialog, select the destination location folder to which you want to move the selected location.
Locations Tab Renaming a Location Specifying a New Name for a Location 3. 4. In the Rename Location dialog, enter the new name for the location. Click OK to rename the location. Note: You cannot rename the location folder Unknown. Deleting a Location When you delete a location folder, the system deletes all subfolders and location nodes below that folder.
Locations Tab Deleting a location 3. Click Yes in the Confirm dialog to remove the selected location. Working with Images This section shows you how to add an image to a location, delete an image from the location, and import a Planner file into a location node. It also shows you how to use the zoom feature while viewing a layout image. Attaching an Image Use the following steps to attach an image: 1. In the Location tree, select the location to which you wish to attach an image. 2.
Locations Tab Specifying a Path to attach an Image 3. On the Select image file to attach to attach to this location dialog, browse to the appropriate image and then click . Zooming In/Zooming Out, Opacity Control, Resolution of an Image Considerable screen area is required to display a large sized layout (for example, 3000 x 2000 sq. ft.) defined or imported in the system. The zooming in/zooming out feature makes it easier to comprehend the RF coverage and device placement information.