
User Manual Part 1


Dashboard Tab
SpectraGuard® Enterprise User Guide
22
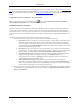
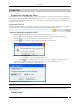
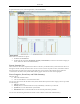
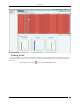
Performance Dashboard – Analysis Section – Bar Graph view
Performance parameters are computed based on detections by a channel-rotating Sensor during the time it, samples a
particular channel. Such sampled data is typically well representative of parameters which are averages (for example,
average data rate), ratios (for example, utilization) or slow varying (for example, associated Clients, active APs, active
Clients). For parameters which are absolute values (for example, traffic), the sampled data typically underestimates
the actual value. Time interval of periodic data collection/sampling is 15 minutes.
Details of various parameters in the Analysis section are provided below.
Table 2 Device Type and dropdown available on the Analysis Section
Device
Type
Dropdown Available
Table columns
Description
For details
APs
Top/Bottom 5 by
Associated Clients
Name, MAC
Address, SSID,
Associations
Refer to Fields in the AP
Performance Tab section
for details
Click on the AP Names appearing
in the Name column in the Table
View or click the Bar Graph in the
Bar Graph View, the AP Details
screen opens with Performance
tab selected
Top/Bottom 5 by Data
Rate
Name, MAC
Address, SSID,
Data Rate
Top/Bottom 5 by
Average Traffic
Name, MAC
Address, SSID,
Traffic
Top/Bottom 5 by
Utilization
Name, MAC
Address, SSID,
Utilization
Clients
Top/Bottom 5 by Data
Rate
Name, Data Rate
Refer to Fields in the
Client Performance Tab
section for details
Click on the Client Names
appearing in the Name column in
the Table View or click the Bar
Graph in the Bar Graph View, the
Clients Details screen opens with
Performance tab selected
Top/Bottom 5 by Traffic
Name, Traffic
Sensors
Top/Bottom 5 by Active
APs
Name, Channel
Number,
Bandwidth, APs
Refer to Fields in the
Sensor Performance Tab
section for details
Click on the Sensor Names
appearing in the Name column in
the Table View or click the Bar
Graph in the Bar Graph View, the
Sensor Details screen opens with
Performance tab selected
Top/Bottom 5 by Active
Clients
Name, Channel
Number,
Bandwidth,
Clients
Top/Bottom 5 by
Interference
Name, Channel
Number, dBm