
User Manual Part 1

Dashboard Tab
SpectraGuard® Enterprise User Guide
21
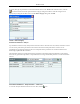
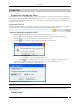
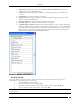
To specify the types of performance events that should be shown in the Trends at the selected location, click the
icon in the Trends section. This opens the Select Category dialog shown below. Select the categories to be
displayed by clicking the checkbox next to it in the Select Category dialog and click OK.
Trends – Select Category
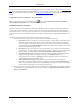
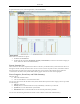
Performance Dashboard – Analysis
Top and bottom wireless activity analysis at the selected location is shown here for APs, Clients, and Sensors. Sensor
records various performance parameters in the wireless network and sends performance records to server
periodically for aggregation/correlation. These recorded performance parameters are rendered as Performance
Monitoring Graphs in the Device Details.
The top/bottom analysis is provided based on the performance monitoring graphs described above. The rank of a
device for any performance parameter is computed based on average value of that parameter over the selected time
interval.
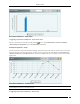
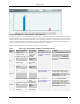
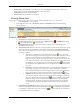
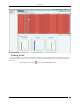
Performance Dashboard – Analysis Section – Table View
To view the Analysis information in form of a bar chart, click the icon.