
User Manual Part 1

Dashboard Tab
SpectraGuard® Enterprise User Guide
20
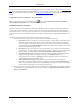
Performance Dashboard – Event Charts
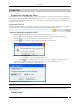
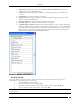
Configuring Performance Dashboard – Event Charts View
Select a location in the Location tree and then click the icon to open Administration->Local->Local Policies-
>Event Settings->Configuration screen with Performance tab selected.
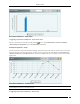
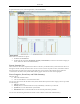
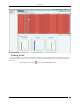
Performance Dashboard – Trends
Trends section of the Performance Dashboard displays line charts based on the category of performance events at the
selected location for a chosen period of time. The choices of time period for the chart display are: Last 4 hours, Last
12 hours, Last 24 hours, or Last 48 hours. These choices are available in the form of a drop-down list as shown in the
figure below.
Performance Dashboard – Trends Section
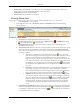
Note: Live events could be counted in multiple time slots that overlap with the event time, whereas Instantaneous events are
counted only in the time slot in which they occurred.
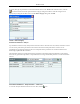
Configuring Performance Dashboard – Trends View