
User Manual Part 1

Dashboard Tab
SpectraGuard® Enterprise User Guide
18
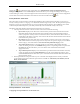
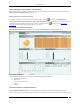
While keeping the mouse on an area of the pie chart shows you the number of events of the corresponding category,
Clicking anywhere in the pie chart takes you to the Events->Performance tab screen showing future details of events
at the selected location.
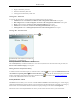
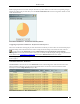
Performance Dashboard – Performance Summary Section
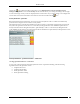
Configuring Performance Dashboard – Performance Summary View
The events considered for showing the pie chart in Performance Summary are those which are selected for Display in
the Event Settings at the selected location. In order to change the Event Settings at the selected location, click the
icon. This will open the Performance tab of the Administration->Local->Local Policies->Event Settings-
>Configuration screen at the selected location where you can directly modify the Display settings of the performance
events. Refer to the Event Settings, Configuration section in the Administration tab for more details.
Note: Configuring Performance Summary, New Events, Events Chart, Trends, and Analysis sections are not visible if WIDS
license is applied.
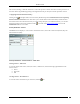
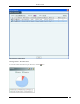
Performance Dashboard – New Events
The New Events section lists the ten recent Performance events in descending order of the start time of the event.
This list includes instantaneous as well as live/expired performance events. The events are listed based on the
Severity Level selected: High, Medium, Low, or All.
Performance Dashboard – New Events Section