
User Manual Part 1

Dashboard Tab
SpectraGuard® Enterprise User Guide
17
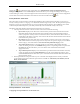
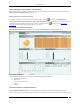
Security Dashboard – Clients Section – Pie Chart View
Select Active, Inactive, or both the checkboxes to view the active/inactive Clients. Click the area in the pie chart; the
Devices->Clients->Selected category screen opens.
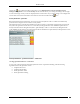
Editing Client Auto-classification Policy
To edit the Client Auto-classification policy at selected location, click the icon to open the Administration-
>Local->Local Policies->Operating Policies->Client Auto-classification screen. To edit the Client classification policy
at another location, select that location in the Location tree and then click the icon. Refer to the Client Auto-
classification section in the Administration tab for more details.
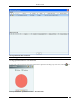
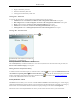
Performance Dashboard: Sections
The Performance Dashboard screen appears by clicking the Performance tab on the Dashboard screen.
Performance Dashboard
The Performance Dashboard screen consists of the following Information Widgets:
Performance Summary
New Events
Performance Event Charts
Trends
Analysis
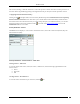
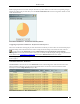
Performance Dashboard – Performance Summary
The Performance Summary displays the overall performance information of the Wi-Fi environment at selected
location. This summary is presented as a pie chart of performance related events based on the Severity of these events.