
User Manual Part 1

Dashboard Tab
SpectraGuard® Enterprise User Guide
14
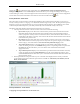
Rogue is denoted by red color
External is denoted by blue color
Uncategorized is denoted by white color
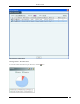
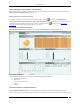
Viewing APs – Table View
To view the AP information, click the following hyperlinked text in the APs section:
Authorized: Click on Authorized, the Devices->APs->Categorized->Authorized screen opens.
Mis-configured: Click on Mis-configured, the Devices->AP->Categorized->Authorized screen opens.
Rogue: Click on Rogue, the Devices->APs->Categorized->Rogue screen opens.
External: Click on External, the Devices->AP->Categorized->External screen opens.
Uncategorized: Click on Uncategorized, the Devices->APs->Uncategorized screen opens
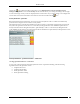
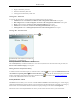
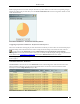
Viewing APs – Pie Chart View
To view the APs information in pie chart form, click the icon.
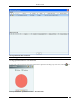
Security Dashboard – APs Section – Pie Chart View
Select Active,Inactive, or both the checkboxes to view the active/inactive APs. Click the area in the pie chart; the
Devices->APs->Selected category screen opens.
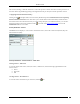
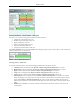
Editing AP Auto-classification Policy
To edit the AP Auto-classification policy at selected location, click the icon to open the Administration->Local-
>Local Policies->Operating PoliciesAP Auto-classification screen. To edit the AP classification policy at another
location, select that location in the Location tree and then click the icon. Refer to the AP Auto-classification
section in the Administration tab for more details.
Security Dashboard – Clients
The Clients section enables you to view lists of all the Active and Inactive Clients that belong to a certain category
(Authorized, Misbehaving, Rogue, External, Guest, and Uncategorized).Clients that do not belong to any category
based on their association status and Client classification policy settings are classified as Uncategorized.
The Clients section of Security Dashboard also shows you the Ad hoc networks seen in your environment.