
User Manual Part 1

Dashboard Tab
SpectraGuard® Enterprise User Guide
12
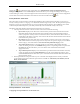
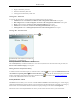
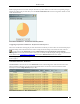
Select Active, Pending, or both the checkboxes to control the pie chart contents. Click the area in the pie chart or on
the names that are hyperlinked (appearing in the legends below the pie chart) to see all the quarantine sessions.
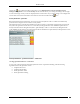
Configuring Intrusion Prevention Policy
Clicking on the in the Quarantine section of Security Dashboard opens the Administration->Local->Operating
Policies->Intrusion Prevention screen. This allows you to edit the Intrusion Prevention Policy and the Intrusion
Prevention Level for the selected location. If you want to change this policy for a different location, you can select
that location in the Location tree and then click the icon. Refer to the Intrusion Prevention section in the
Administration tab for more details.
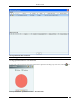
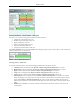
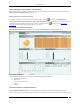
Security Dashboard – Sensors
The Sensors section displays a count of Active and Inactive Sensors, Sensor-AP combo devices(Sensor/AP), and
Network Detectors (ND).
Security Dashboard – Sensors Section – Table View
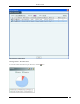
Viewing Sensors – Table View
To view the details of the Sensor, Sensor/AP combo, or ND devices, click the following hyperlinked text in the
Sensors section:
Sensor
Sensor/AP
ND
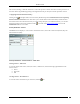
Viewing Sensors – Pie Chart View
To view the Sensors information in pie chart form, click the icon.