
User Manual Part 1

Dashboard Tab
SpectraGuard® Enterprise User Guide
9
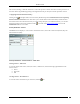
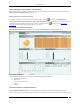
Clicking the icon in the New Events section takes you to Administration->Local->Local Policies->Event
Settings->Configuration screen with Security tab selected. This allows you to change the settings of Event types to
control which type security events are displayed at the current location. If you want to change an event configuration
at some other location, then select that location in the Location tree and then click the icon.
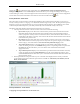
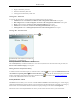
Security Dashboard – Event Charts
The system shows two Event Charts on the Security Dashboard. The event drop-down list allows you to focus on
security events (by location or category), or on APs/Wi-Fi Clients having security events. The time period drop-down
list allows you to focus on the last 48 hours or a choice of interval in the last 24 hours. The availability of two charts
on the Security Dashboard improves your ability to efficiently notice and handle security issues, if any.
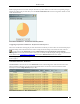
The details of the charts displayed based on the drop-down list are as follows:
1. The drop-down list of events or devices to show on the chart contains the following:
By Location: Displays a bar chart with a count of Security events for the selected location and its
immediate child locations (The selected location is marked with * in the legend of the chart). In
order to jump to the security events at one of these locations, click on the bar for that location. You
will be taken to the Events ->Security ->All screen for that location and that location will be selected
in the location tree panel as well.
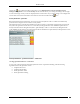
By Category: Displays a bar chart with a count of Security events for each security event category
at the current location. In order to jump to the security events of a specific category, click on the bar
for that category. You will be taken to the Events->Security->Selected category screen.
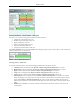
Top 5 APs by Events: Displays a bar chart for the top 5 APs based on the number of Security
events. On clicking on any bar, the AP Details dialog for the corresponding AP device opens with
the Events tab selected. This allows you to view all the events related to that AP and take
appropriate actions.
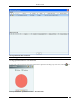
Top 5 Clients by Events: Displays a bar chart for the top 5 Clients based on the number of Security
events. On clicking any bar, the Client Details dialog for the corresponding Client device opens
with the Events tab selected. This allows you to view all the events related to that Client device and
take appropriate actions.
2. The drop-down list for time period allows you to control the chart display based on security events that
occurred in the chosen period. The time period choices available are: Last 4 Hours, Last 12 Hours, Last 24
Hours, or Last 48 Hours.
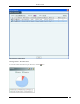
Security Dashboard – Event Charts
Configuring Security Dashboard – Event Charts View