User Guide SpectraGuard® Enterprise An AirTight® Product A Comprehensive Wireless IPS and Performance Management Solution Version 6.7 Update 2 AirTight® Networks, Inc., 339 N. Bernardo Avenue, # 200, Mountain View, CA 94043 http://www.airtightnetworks.com Product documentation is being enhanced continuously based on customer feedback. To obtain a latest copy of this document, visit http://www.airtightnetworks.com/home/support.
This page has been intentionally left blank.
SpectraGuard® Enterprise User Guide
END USER LICENSE AGREEMENT Please read the End User License Agreement before installing SpectraGuard® Enterprise. The End User License Agreement is available at the following location -.http://www.airtightnetworks.com/fileadmin/pdf/AirTightEULA.pdf. Installing SpectraGuard® Enterprise constitutes your acceptance of the terms and conditions of the End User License Agreement. DISCLAIMER THE INFORMATION IN THIS GUIDE IS SUBJECT TO CHANGE WITHOUT ANY PRIOR NOTICE. AIRTIGHT® NETWORKS, INC.
FEDERAL COMMUNICATIONS COMMISSION INTERFERENCE STATEMENT (Section 15.105) This equipment has been tested and found to comply with the limits for a Class B digital device, pursuant to part 15 of the FCC Rules. These limits are designed to provide reasonable protection against harmful interference in a residential installation.
Utilisez l’appareil de sans fil de façon à minimiser les contacts humains lors du fonctionnement normal. Ce périphérique a également été évalué et démontré conforme aux limites d'exposition aux RF d'IC dans des conditions d'exposition à des appareils mobiles (antennes sont supérieures à 20 cm à partir du corps d'une personne). FCC NOTICE: To comply with FCC part 15 rules in the United States, the system must be professionally installed to ensure compliance with the Part 15 certification.
Table Of Contents Table Of Contents Getting Started ............................................................................................................................................................................... 1 Before You Begin ........................................................................................................................................................................ 1 Overview and Organization ...................................................................
Table Of Contents Event Details Dialog ............................................................................................................................................................ 32 Acknowledging an Event........................................................................................................................................................ 33 Deleting an Event ....................................................................................................................
Table Of Contents Sensor Events Tab ............................................................................................................................................................ 95 Sensor Performance Tab .................................................................................................................................................. 96 Sensor Spectrum Tab ..........................................................................................................................
Table Of Contents List of Sections ................................................................................................................................................................ 141 Managing Reports .................................................................................................................................................................. 142 Adding a Report ...............................................................................................................
Table Of Contents Smart Device Type ......................................................................................................................................................... 181 Import Devices ............................................................................................................................................................... 183 Thresholds................................................................................................................................
Table Of Contents Deleting a SAFE Group ................................................................................................................................................. 258 Settings ............................................................................................................................................................................ 258 Manage Clients ........................................................................................................................
Getting Started Getting Started Before You Begin Thank you for purchasing SpectraGuard® Enterprise (referred to as ‘system’ hereafter in this document) from AirTight® Networks, Inc. The system assists you to effectively monitor, troubleshoot, administer, and protect your wireless network. Overview and Organization This user guide gives an overview of the User Interface (referred to as ‘Console’ hereafter in this document) and helps you familiarize with the following top-level tabs.
Navigation Bar and Global Functions Navigation Bar and Global Functions A Quick Tour of the Console The Console consists of the following top-level tabs and additional buttons. This section explains how to use the Console navigation bar and global functions. Navigation Bar The Console navigation bar includes the following tabs: Dashboard, Events, Devices, Locations, Reports, Forensics, and Administration. Navigation Bar The following table describes the items in the navigation bar.
Navigation Bar and Global Functions Click to expand the sub nodes. Click to collapse the sub nodes. Double-click the node text to either expand or collapse sub nodes. Dialogs The following functions apply to all dialogs in the system. Depending on options available in a particular dialog, you can: Click OK to save all the changes and close the dialog. Click Cancel to discard the changes and close the dialog. Click Apply to save all changes and keep the dialog open.
Behavior of SpectraGuard Enterprise Servers controlled through SpectraGuard Manager Behavior of SpectraGuard Enterprise Servers managed through SpectraGuard Manager Introduction The behavior of the SpectraGuard Enterprise servers that are managed through SpectraGuard Manager, is slightly different from the SpectraGuard Enterprise servers that are managed individually. Version 6.6 onwards, SpectraGuard Managed Network Console (SpectraGuard -MNC) has been renamed as SpectraGuard Manager.
Dashboard Tab Dashboard Tab Introduction: Panel Displaying WLAN Snapshot The Dashboard screen enables you to view a snapshot of your WLAN security status and performance. The Security snapshot is provided in terms of overall security status, security events and charts, quarantine activity status and category-wise device summary. The Performance snapshot presents a summary of performance events based on severity, performance event charts, and latest trends in factors contributing to performance issues.
Dashboard Tab The Location tree shows the complete list of locations created for your WLAN in the system. Vulnerability status icon before each location name shows the vulnerabilty status of that location. To view the Dashboard for a particular location, select the appropriate node in the Location tree. Security Dashboard: Sections Security Dashboard screen appears by default when you log into the system. Alternatively, click the Security tab on the Dashboard screen to view the Security Dashboard.
Dashboard Tab To specify the types of events that are considered when determining the Security Scorecard status at a particular location, select a location in the Location tree and then click the icon to open Administration->Local->Local Policies->Event Settings->Configuration screen with Security tab selected. Refer to the Event Settings, Configuration section in the Administration tab for more details.
Dashboard Tab event from the Vulnerable Location dialog and click to remove it from the consideration for vulnerability status. The system shows the Remove from Scoreboard dialog which allows you take the removal action and add a comment to mark that action before removing it from set of events that contributed to vulnerability.
Dashboard Tab Clicking the icon in the New Events section takes you to Administration->Local->Local Policies->Event Settings->Configuration screen with Security tab selected. This allows you to change the settings of Event types to control which type security events are displayed at the current location. If you want to change an event configuration at some other location, then select that location in the Location tree and then click the icon.
Dashboard Tab Clicking the icon in the Event Charts section takes you to Administration->Local->Local Policies->Event Settings->Configuration screen with the Security tab selected. This allows you to change the settings of Event types to control which type security events are displayed at the current location. If you want to change event configuration at some other location, then select that location in the Location tree and then click the icon.
Dashboard Tab List of Quarantined APs and Clients Note: Viewing Quarantined Devices – Table/Pie Chart View section is not visible if WIDS license is applied. Viewing Quarantined Devices – Pie Chart View To view a list of APs and Clients with status Quarantined or Quarantine Pending in pie chart form, click the icon.
Dashboard Tab Select Active, Pending, or both the checkboxes to control the pie chart contents. Click the area in the pie chart or on the names that are hyperlinked (appearing in the legends below the pie chart) to see all the quarantine sessions. Configuring Intrusion Prevention Policy Clicking on the in the Quarantine section of Security Dashboard opens the Administration->Local->Operating Policies->Intrusion Prevention screen.
Dashboard Tab Security Dashboard – Sensors Section – Pie Chart View Select Active, Inactive, or both the checkboxes to view the active/inactive Sensors. Clicking on any area in the pie chart takes you to the DevicesSensors screen. Editing Sensor Configuration To access device Configuration editing functionality from the Dashboard, click the icon to open the Administration->Local->Local Policies->Device Template screen at the selected location.
Dashboard Tab Rogue is denoted by red color External is denoted by blue color Uncategorized is denoted by white color Viewing APs – Table View To view the AP information, click the following hyperlinked text in the APs section: Authorized: Click on Authorized, the Devices->APs->Categorized->Authorized screen opens. Mis-configured: Click on Mis-configured, the Devices->AP->Categorized->Authorized screen opens. Rogue: Click on Rogue, the Devices->APs->Categorized->Rogue screen opens.
Dashboard Tab Security Dashboard – Clients Section – Table View Entries are color coded according to the specified classification policies: Authorized is denoted by green color Misbehaving is denoted by orange color Rogue is denoted by red color Guest is denoted by light green color External is denoted by blue color Uncategorized is denoted by white color The Ad hoc Networks sub-section in the Clients section displays all peer-to-peer wireless, that is, ad hoc connections between wireless devi
Dashboard Tab List of Ad hoc Connections Viewing Clients – Pie Chart View To view the Clients information in pie chart form, click the icon.
Dashboard Tab Security Dashboard – Clients Section – Pie Chart View Select Active, Inactive, or both the checkboxes to view the active/inactive Clients. Click the area in the pie chart; the Devices->Clients->Selected category screen opens. Editing Client Auto-classification Policy To edit the Client Auto-classification policy at selected location, click the icon to open the Administration>Local->Local Policies->Operating Policies->Client Auto-classification screen.
Dashboard Tab While keeping the mouse on an area of the pie chart shows you the number of events of the corresponding category, Clicking anywhere in the pie chart takes you to the Events->Performance tab screen showing future details of events at the selected location.
Dashboard Tab You can select an event row from this list and double-click to see the event details screen. Refer to the Viewing Events Lists section in the Events tab for more details. Select an event row and right click to open a context sensitive menu of actions that can be taken on that event. Refer to the Events Context-Sensitive Menu section in the Events tab for more details.
Dashboard Tab Performance Dashboard – Event Charts Configuring Performance Dashboard – Event Charts View Select a location in the Location tree and then click the icon to open Administration->Local->Local Policies>Event Settings->Configuration screen with Performance tab selected. Performance Dashboard – Trends Trends section of the Performance Dashboard displays line charts based on the category of performance events at the selected location for a chosen period of time.
Dashboard Tab To specify the types of performance events that should be shown in the Trends at the selected location, click the icon in the Trends section. This opens the Select Category dialog shown below. Select the categories to be displayed by clicking the checkbox next to it in the Select Category dialog and click OK. Trends – Select Category Performance Dashboard – Analysis Top and bottom wireless activity analysis at the selected location is shown here for APs, Clients, and Sensors.
Dashboard Tab Performance Dashboard – Analysis Section – Bar Graph view Performance parameters are computed based on detections by a channel-rotating Sensor during the time it, samples a particular channel. Such sampled data is typically well representative of parameters which are averages (for example, average data rate), ratios (for example, utilization) or slow varying (for example, associated Clients, active APs, active Clients).
Dashboard Tab Dashboard Tab – User Saved Settings The following User choices made during browsing of Dashboard Tab are saved by the system: All the options that the user can select that is, Table/Pie chart, Time Filters, drop-down list, radio buttons, check boxes for all sections displayed on Performance and Security Dashboard These settings are saved on log out as well as movement to other tabs on the Console.
Events Tab Events Tab Events: Panel Displaying Alerts The Events screen provides information about events generated by the system. The system classifies events into the following types: Security, System, and Performance. On this screen, you can view, filter, locate, acknowledge, mark as read or unread, and toggle the state of the event’s participation in vulnerability computation. The option of EventPagination is also present.
Events Tab To open the Events screen, on the navigation bar, select the Events tab Events Screen The Events screen includes two panes: 1. On the left, the Location tree 2. On the right, the event tabs: All, Security, System, and Performance, event list for the selected category of events, and event charts in the Table Summary. Events: Location Tree The Location tree shows the complete list of locations created for your WLAN in the system.
Events Tab Event Severity: High, Medium, or Low. The event rows are highlighted in red, orange, or yellow color based on the severity level being High, Medium, or Low respectively. Event Status: New, Read, or Acknowledged Activity Status: Live, Instantaneous, or Expired Viewing Events Lists You must view events in order to take corrective actions. Use the following steps to view an event list: 1. In the Location tree, select a location. 2.
Events Tab Type Icon: Indicates the type of the event – Security, System, or Performance. This column is visible only if you select the tab All in step 2. Location: Shows the probable location of the devices participating in the event when the event occurred. Event Details: Gives a short description of the event. Category: Specifies the event’s sub-category within a selected event type. This column is visible only if you select the tab All in step 2.
Events Tab Sorted Events List Filtering Events To focus your attention to a subset of events based on a filtering criteria (such as events in a particular time period, or of particular category, and so on) system provides you with the capability to filter events. Use the following steps to filter events: 1. On the Events screen, click the icon to open the Filter Events dialog.
Events Tab Filtering Events 2. 3. 4. 5. In the Time Filter dialog, do one of the following: Under Events in select the following Events in last 5 Minutes, Events in last 1 Hour, Events in last 1 Day, orCustomize to choose a From and To Date as described below. Default: All Events. Select Customize under the drop-down menu in Events in and then choose either of the following: Under From Date, click the icon to specify a start date and time and then click OK.
Events Tab 6. Select the checkbox, Event ID, to enter event IDs manually for searching data related to it. 7. Select the checkbox, Text Filter, to enter search text to select events containing the text in event details. 8. Select the checkbox, Causes Vulnerability?, to select those Events which have been selected to contribute to Vulnerability. 9. Select the checkbox, Show deleted events, to view deleted events. Event text appears as strikethrough when you select this checkbox. 10.
Events Tab Events Context-Sensitive Menu Items in the Events Context-Sensitive Menu The Events context-sensitive menu includes the following items. Details: Opens the Events Details dialog explained in the Event Details Dialog section. This option is unavailable if you select multiple events. Locate: Opens the Locate Event dialog explained in the Tracking the Location of an Event section and enables you to track the location of an event by tracking the location of devices involved in that event.
Events Tab Event Details Dialog To open the Events Details dialog, on the Events screen, double-click an event row. Events Details Dialog The Events Details dialog gives information about the selected event, which helps you determine the appropriate response. The various fields and buttons in this dialog are: Short Description: Provides a brief description of the event. This is presented as bold text at the top of the dialog. Event Detailed Description: Gives a detailed description of the event.
Events Tab AP has become inactive Event expired Under Updated Date/Time column, you can view the date and time of generation of the sub-event.
Events Tab 2. From the resulting menu, select Delete. 3. In the Confirm dialog, click to delete the event. If you have selected the Show deleted events checkbox on the Filter Events dialog, the text for this deleted event row appears as strikethrough. Recommended: AirTight recommends that you delete an event only after you view it and have taken the necessary action. Undeleting an Event Use the following steps to undelete an event: 1. On the Events screen, right-click an event row that is deleted.
Events Tab Viewing Additional Information about an Event Tracking the Location of an Event You can track the location of an event by tracking the location of each participating AP, Client, or attacker device.
Events Tab 1. On the Events screen, right-click an event row and then from the resulting menu, select Locate. This opens the Event Details dialog as shown below: Tracking the Location of an Event 2. On the Event Details dialog, perform the following: Under Sub Events, select a sub-event Under Participating Devices, select a device participating in the selected sub-event Click to view the current location of the device.
Events Tab Event Time Location dialog Viewing Properties of Devices associated with an Event To view/edit the properties of an AP, Client, or Sensor associated with an event use the following steps to access the corresponding device menu: 1. On the Events screen, double-click an event row. 2. On the Event Details dialog, under Participating Devices, right-click a device row and select Details from the resulting menu. The right-click options are same as that of Device Details dialog.
Events Tab Viewing Device Properties from Events Details Dialog Events Tab: User Saved Settings The following User choices made during browsing of Events Tab are saved by the system. Display Columns and their order Events Filter Page Size These settings are saved on log out as well as movement to other tabs on the Console.
Devices Tab Devices Tab Devices: Panel Displaying WLAN Devices The Devices screen provides information about APs, clients, sensors, sensor/AP combos, and networks visible to the system. On this screen, you can view/edit their details, sort the display based on their properties, carry out a variety of operations, like changing their location, changing their classification, initiating quarantine activities, and troubleshooting an AP, a Client, a Sensor or a Sensor/AP Combo.
Devices Tab To open the Devices screen, on the navigation bar, select the Devices tab Devices Screen The Devices screen includes two panes: On the left, the Location tree. On the right, device category tabs, device lists, and table summary. Devices: Location Tree The Location tree shows the complete list of locations for your WLAN in the system. The devices at the selected location are shown in the pane on right.
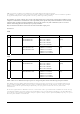
Devices Tab Network Connectivity Yes Active Status Yes 802.11 Protocol (with or without Yes 802.11n capability) Yes Security Settings Yes Yes Mis-configured Rogue External Networked Non-Networked Indeterminate Active Inactive a b only b/g a/b/g Other 802.11i Wi-Fi Protected Access (WPA) Wired Equivalent Privacy (WEP) Open Multi Unknown Note: The system labels APs that are imported and whose protocol information is not available as Other.
Devices Tab 2. 3. On the right, a list of APs/Clients tagged to that location appears; select either the APs or Clients tab. On the header, next to the Search icon, select the Include Inactive APs/Clients check box to view the inactive APs/Clients in the list. 4. Select either the Uncategorized or Categorized tab under APs or Clients to organize devices. For Categorized APs, select one of these tabs: All, Authorized, Rogue, or External.
Devices Tab Troubleshooting Status Icon: Identifies whether troubleshooting is in progress on the specified AP or Client, or both. SpectraGuard Security Agent For Endpoints (SAFE) Status Icon: Identifies the SAFE installation status – Installed-Active, Installed-Inactive, or Not Installed. SAFE Risk Level Icon: Identifies the SAFE risk level – High, Medium, or Low.
Devices Tab Devices Tab – Display Columns Screen Note: The columns Network Status Icon, Security, Encryption, 11w/MFP, Authentication, Channel, Network, and Associated Clients appear only in the APs list. SAFE Status Icon, SAFE Risk Level Icon, Group, Associated AP, and Cell ID appear only in the Clients list. Viewing Sensors List Use the following steps to open a Sensors list. 1. In the Location tree, select a location. 2.
Devices Tab Sensors List The Devices screen shows the following information about Sensors: Device Type and Status Icon: Identifies the type of Sensor – Sensor, Sensor/AP combo, ND, and its status – Active, Inactive, Upgrade Required, or Upgrade in Progress. Troubleshooting Status Icon: Identifies if troubleshooting is in progress on the specified Sensor. Name: Specifies the user-defined name for the Sensor.
Devices Tab 2. tab. On the right, a list of devices, and networks tagged to that location appears; select the Networks The following figure displays the Networks tab. Networks tab The Networks tab shows the following information about the networks detected by the SGE sensors Monitored Status:specifies whether the network is monitored or unmonitored by SGE sensor. The icon indicates that the network is monitored. The icon indicates that the network is unmonitored.
Devices Tab Configure display column list for Networks Tab You can select/deselect the checkbox next to the column name to view/remove it from Device display. You can change the display order of a column by selecting the column name and moving it up or down with Up/Down buttons. Save the display settings by clicking the Save button. Sorting a Device List The system enables you to sort a device list so that you can arrange information according to your requirements.
Devices Tab Sorted Device List Location Tagging of a Device or Location Tag Assignment Device location tagging refers to the process by which a device obtains the label of a location. Tagging is of two types: Automatic and Manual. Automatic Location Tagging (Auto Location Tagging) The system automatically assigns a location to a device depending on the Automatic Location Tagging policy selected and the signal strength of the Sensors reporting the device (see Auto Location Tagging).
Devices Tab APs are wireless devices to which wireless Clients (laptops, PDAs, and so on) connect and communicate with other devices on the Local Area Network (LAN).
Devices Tab AP Context-Sensitive Menu on Devices Screen Items in the AP Context-Sensitive Menu The AP context-sensitive menus include the following items.