
User's Manual

SettingȱupȱtheȱServerȱConsoleȱ
SpectraGuard
®
ȱEnterpriseȱInstallationȱGuideȱ
82ȱ
ȱ
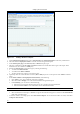
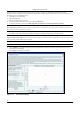
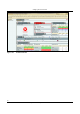
Figure 111. Adding a Section to a Report
c. OnȱtheȱAddȱSectionȱtoȱReportȱdialog,ȱenterȱaȱSectionȱNameȱandȱaȱSectionȱDescriptionȱforȱtheȱnewlyȱaddedȱsection.ȱ
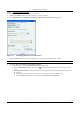
d. SelectȱtheȱcheckboxȱDisplayȱthisȱsectionȱtoȱviewȱthisȱsectionȱinȱtheȱgeneratedȱreport.ȱ
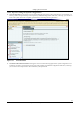
e. UnderȱSectionȱQueryȱType,ȱselectȱDevice,ȱEvent,ȱorȱSAFEȱasȱtheȱqueryȱtype.ȱ
f. Selectȱanyȱ
combinationȱofȱtheȱAP,ȱClient,ȱandȱSensorȱcheckboxesȱtoȱincludeȱtheseȱdeviceȱtypesȱinȱtheȱreport.ȱTheseȱ
checkboxesȱareȱnotȱavailableȱforȱaȱSAFEȱquery.ȱ
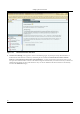
g. DescribeȱtheȱSectionȱQueryȱconstructionȱlogicȱbyȱselectingȱtheȱfollowing:ȱ
x AȱcolumnȱfromȱSelectȱColumnȱ
x Aȱconditionȱfrom
ȱSelectȱConditionȱ
x Anȱobjectȱforȱ
theȱquery,ȱwhichȱyouȱcanȱselectȱorȱenterȱ
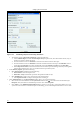
h. Optionally,ȱselectȱoneȱorȱmoreȱBooleanȱconnectorsȱ(ORȱorȱAND)ȱtoȱjoinȱtwoȱorȱmoreȱqueries.ȱClickȱ<Delete>ȱtoȱdeleteȱaȱ
query.ȱ
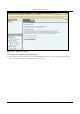
i. UnderȱSelectȱColumnsȱtoȱbeȱdisplayedȱinȱSectionȱResults,ȱdoȱtheȱfollowing.ȱ
x Clickȱ<Add>ȱtoȱviewȱa
ȱlistȱofȱattributesȱandȱselectȱanȱattribute.ȱ
x SelectȱtheȱcheckboxȱDisplayȱtoȱviewȱtheȱselectedȱattributeȱinȱtheȱgeneratedȱreport.ȱ
x UnderȱSummary,ȱyouȱcanȱchooseȱtoȱdoȱtheȱfollowing:ȱ
¾ SelectȱtheȱtypeȱofȱchartȱfromȱtheȱdropȬdownȱlistȱtoȱviewȱaȱgraphȱforȱtheȱselectedȱattribute.ȱ
¾ Select
ȱtheȱcheckboxȱTableȱtoȱviewȱaȱtabulatedȱcountȱforȱtheȱselectedȱattribute.ȱ
Note:ȱPieȱchartsȱareȱnotȱvisibleȱinȱanȱHTMLȱreport.ȱYouȱcanȱviewȱpieȱchartsȱonlyȱinȱaȱPDFȱreport.ȱ
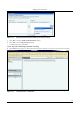
x Selectȱanȱattributeȱandȱclickȱ<Delete>ȱtoȱdeleteȱthatȱattribute.ȱ
x Selectȱanȱattributeȱandȱclickȱ<Up>ȱorȱ<Down>ȱtoȱorganizeȱtheȱattributesȱthatȱappearȱasȱcolumnsȱinȱtheȱSectionȱResultsȱ
tableȱofȱtheȱgeneratedȱreport.ȱ
j. Toȱsaveȱtheȱsectionȱtoȱanȱexistingȱreport,ȱclickȱ<SaveȱSectionȱ
toȱReport>.ȱToȱsaveȱtheȱsectionȱwithȱaȱnewȱname,ȱclickȱ<Saveȱ
toȱReportȱasȱNewȱSection>.ȱ