
User's Guide


Dashboard
165
In general, click , wherever available, to refresh the data on the widget. Click to view a description
of the widget functionality. Click to close the widget.
Client Widgets
You can see widgets related to clients by clicking Clients on the dashboard. The client widgets on the
dashboard are as follows.
Smart Devices Distribution
This chart displays the number of smart phones and tablets on your Wi-Fi network. Use the SSID
and Time filters to respectively view the statistics for a specific Wi-Fi network and during a specific
period.
Client Protocol Distribution
This chart displays the number of associated clients according to the Wi-Fi protocol they are using:
802.11a, 802.11bg, 802.11an and 802.11bgn. You can filter the data by using the SSID to filter the
statistics for a specific Wi-Fi network.
Clients by Traffic
This chart displays clients based on the amount of traffic generated. Traffic includes both uplink
and downlink data transferred. Use the Time, Top/Bottom and the Number filters to respectively
view the Statistics during a specific period, top or bottom and the number of clients.
Clients by Data Rate
This chart displays clients based on the average data rate. Clients experiencing very low data rate
may be in the fringe areas of your Wi-Fi network or they may be low speed legacy devices (e.g.,
802.11b). In either case, such clients are likely to impact the net capacity of the Wi-Fi network. Use
the Time, Top/Bottom and the Number filters to respectively view the Statistics during a specific
period, top or bottom and the number of clients.
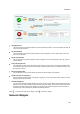
In general, click , wherever available, to refresh the data on the widget. Click to view a
description of the widget functionality. Click to close the widget.
Access Point Widgets
You can see widgets related to access points (AP) by clicking Access Point on the dashboard. The AP
widgets are as follows.
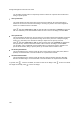
APs by Association
This chart displays upto 10 APs with the most or least number of associated clients.
Click and select Chart type as Top (to view APs with most number of associated clients) or
Bottom (to view APs with least number of associated clients). Enter the maximum number of APs
to view on the widget, and click Save.
Use the SSID and Time filters to respectively view the statistics for a specific Wi-Fi network and
during a specific period.
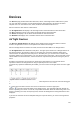
APs by Traffic
This chart displays upto 10 APs with the most or least traffic, including downlink and uplink. Click
and select Chart type as Top (to view APs with most traffic) or Bottom (to view APs with
least traffic). Enter the maximum number of APs to view on the widget, and click Save.