
Specifications


18 Starting with Pure Data
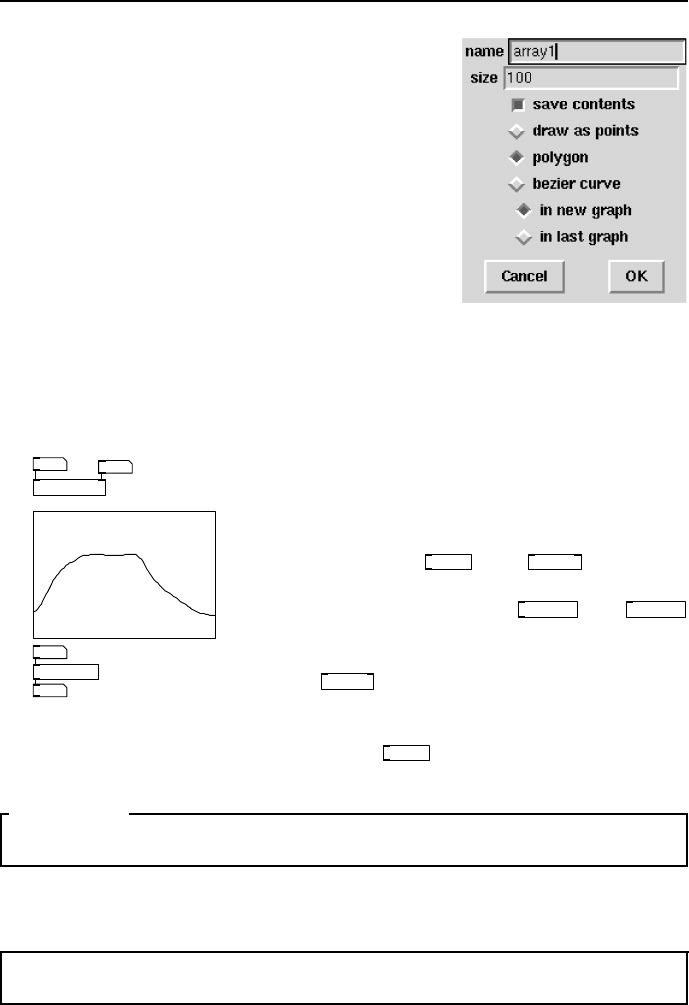
fig 2.12: Create arr ay.
To create a new array select Put→Array from the
menu and complete the dialog box to set up its
name, size and display characteristics. On the can-
vas a graph will appear showing an array with all
its va lues initialised to zero. The Y-axis range is
−1.0 to +1.0 by default, so the data line will be in
the centre. If the save contents box is checke d
then the array data will be saved along with the
patch file. Be awar e that long sound files stored
in arrays will make large patch files when saved
this way. Three draw styles are available, points,
polygon and Bezier to show the data with varying
degrees of smoothing. It is possible to use the same
graph to display more than one ar ray, which is very useful when you wish to see
the relationship between two or more sets of data. To get this behaviour use
the in last graph option when creating an array.
0.25
24
24
0.25
tabwrite a1
tabread a1
a1
fig 2.13: Accessing an array.
Data is written into or read from a table by an
index number which refers to a po sition within
it. The index is a whole number. To read and
write arrays several kinds of accessor object are
available. The
tabread
and
tabwrite
objects al-
low you to communicate with arrays using mes-
sages. Later we will meet
tabread4~
and
tabwrite~
objects that can read and write audio signals.
The array a1 shown in Fig. 2.13 is written to by
the
tabwrite
object above it, which specifies the
target array name as a parameter. The right in-
let sets the index and the left one sets the value.
Below it a
tabread
object takes the index on its
inlet and returns the current value.
SECTION 2.4
Getting help with Pure Data
At http://puredata.hurleur.com/ there is an active, friendly forum, and
the mailing lis t c an be subscribed to a t pd-list@iem.at
Exercises
Exercise 1
On Linux, type pd --help a t the console to see the available startup optio ns.
On Windows or MacOSX read the help documentation that comes with your
downloaded distr ibution.