
Specifications

428
FDEN-H
Noise level 45 dB (A) at HIGH
39 dB (A) at LOW
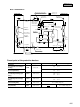
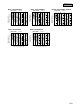
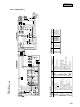
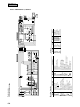
10.2.7 Noise level
Notes (1) The data are based on the following conditions.
Ambient air temperature:
Indoor unit 27˚C DB, 19˚C WB.
Outdoor unit 35˚C DB.
Outdoor unit
Measured based on JIS B 8616
Mike position: at highest noise level
in position as below
Distance from front side 1 m
Height 1 m
Unit
1 m
1 m
Mike (front & at low point)
Mid octave band frequency (Hz)
N30
N20
N50
N60
N70
63 125 250 500 1000 2000 4000 8000
20
30
40
50
60
70
20
30
40
50
60
70
N40
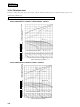
Sound pressure level
(Standard 0.0002µ bar) dB
Model FDEN308H
Mid octave band frequency (Hz)
N30
N20
N50
N60
N70
63 125 250 500 1000 2000 4000 8000
20
30
40
50
60
70
20
30
40
50
60
70
N40
Sound pressure level
(Standard 0.0002µ bar) dB
Mid octave band frequency (Hz)
N30
N20
N50
N60
N70
63 125 250 500 1000 2000 4000 8000
20
30
40
50
60
70
20
30
40
50
60
70
N40
Sound pressure level
(Standard 0.0002µ bar) dB
Mid octave band frequency (Hz)
N30
N20
N50
N60
N70
63 125 250 500 1000 2000 4000 8000
20
30
40
50
60
70
20
30
40
50
60
70
N40
Sound pressure level
(Standard 0.0002µ bar) dB
Mid octave band frequency (Hz)
N30
N20
N50
N60
N70
63 125 250 500 1000 2000 4000 8000
20
30
40
50
60
70
20
30
40
50
60
70
N40
Sound pressure level
(Standard 0.0002µ bar) dB
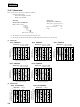
Model FDC208HEN3A
Noise level 52dB (A)
Model FDC258HEN3A
Noise level 52dB (A)
Mid octave band frequency (Hz)
N30
N20
N50
N60
N70
63 125 250 500 1000 2000 4000 8000
20
30
40
50
60
70
20
30
40
50
60
70
N40
Sound pressure level
(Standard 0.0002µ bar) dB
Noise level 49 dB (A) at HIGH
49 dB (A) at LOW
Model FDEN408H
Noise level 50 dB (A) at HIGH
44 dB (A) at LOW
Model FDEN508H
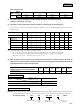
(2) Outdoor unit
(1) Indoor unit
Mid octave band frequency (Hz)
N30
N20
N50
N60
N70
63 125 250 500 1000 2000 4000 8000
20
30
40
50
60
70
20
30
40
50
60
70
N40
Sound pressure level
(Standard 0.0002µ bar) dB
Noise level 44 dB (A) at HIGH
39 dB (A) at LOW
Model FDEN258H
Noise level 43 dB (A) at HIGH
38 dB (A) at LOW
Model FDEN208H
Indoor unit
Measured based on JIS B 8616
Mike position as below
(2) The data in the chart are measured in an unechonic room.
(3) The noise levels measured in the field are usually higher than the data because of reflection.