
Motors Air Conditioning Control System Operating Manual


35
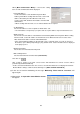
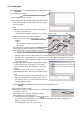
3.7.3 Trend graph
Clicking at 3.7.2 (2) [GRAPH] displays Trend Graph Screen.
(1) Procedure for graphing
(a)Click [Option] on the menu bar.
(b)The sub-menu of "Graph detail setting" and "Other setting"
will be displayed. Click "Graph detail setting" to set each
item of the graph.
*Note
Without setting of each item on "Graph detail setting,"
no graph can be displayed.
(The graph detail setting is explained in (c) and other setting is in (d).)
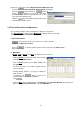
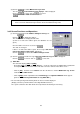
(c) Graph Detail Setting Screen will be displayed.
1) Click your desired number (from Graph 1 ~ 5) for
graphing.
*Note
The number of the graph selected represents
the ordinate.
2) Select [Unit] desired to be graphed.
3) Select [Source] (Data item) desired to be graphed.
4) Set [Upper limit, Lower limit] of data. You may also
set to [Auto-scale].
- When the data exceeds the high limit value or low limit value being set under [Auto-scale] setting,
the above value is replaced by the exceeded value in the setting. When the high limit value and low
limit value are set before entering, 10 will be set to the high limit value and 0 will be to the low limit
value automatically.
5) [Graph upper limit, Graph lower limit] (Ordinate display
position/range) may be acceptable as it is. Setting is
required when the display position/range is desired to
change.
(To display over the entire screen, enter 100 to the
graph high limit position, while 0 to the low limit position.)
*Note
The input of the upper limit value/lower limit value and
graph upper limit position/lower limit position can be
entered by the ten keys for numerical input besides the
entering by the key board.
6) Click after completing all setting to return to Trend Graph Screen.
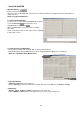
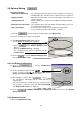
(d) Conducting the "Other setting"
With "Other setting," the optional function to facilitate graph
observation can be set.
Click [Option] on the menu bar. Click "Other setting."
Other Setting Screen will be displayed.
1) Moving [Scroll bar] by dragging or clicking changes
the value of the horizontal grid line from 0 to 4. The horizontal grid line will be displayed on the
graph in a number of the value above.
*The sampling time can not be set by on-line.
6
)
5
)
Upper limit value/graph upper limit position
Lower limit value/Graph lower limit position