
User`s manual


Table Of Contents
- SAFETY PRECAUTIONS
- CONDITIONS OF USE FOR THE PRODUCT
- REVISIONS
- INTRODUCTION
- CONTENTS
- ABOUT MANUALS
- HOW TO USE THIS MANUAL
- ABOUT THE GENERIC TERMS AND ABBREVIATIONS
- PACKING LIST
- 1. OVERVIEW
- 2. SYSTEM CONFIGURATION
- 3. FUNCTION LIST
- 4. INSTALLATION AND UNINSTALLATION
- 5. SCREEN MAKEUP AND BASIC OPERATIONS
- 6. PROJECT CREATION
- 7. SYSTEM CHECKING FROM PERIPHERAL DEVICE
- 8. DATA SETTING
- 9. WRITING TO/READING OF/VERIFICATION OF POSITIONING MODULE DATA
- 10. POSITIONING DEBUGGING
- 11. USEFUL FUNCTIONS
- APPENDIX
- Appendix 1 Read from Module/Write to Module Reference Processing Times
- Appendix 2 Restrictions Depending on Function Version of QD75
- Appendix 3 Functions Added to/Changed from the Previous Versions
- Appendix 4 Uninstalling the License Key FD
- Appendix 5 Parameter Names Shown in GX Configurator-QP Screens and Manuals
- INDEX
11 - 36 11 - 36
MELSOFT
11. USEFUL FUNCTIONS
DISPLAY/SETTING DATA
Item Description
Maximum value
Minimum value
Show the maximum and minimum values during tracing of each data.
Time Shows the tracing time.
Waveform data
Shows the trace results.
The horizontal axis indicates time.
The vertical axis represents the value of the traced data.
Use the scroll bars to move the display position.
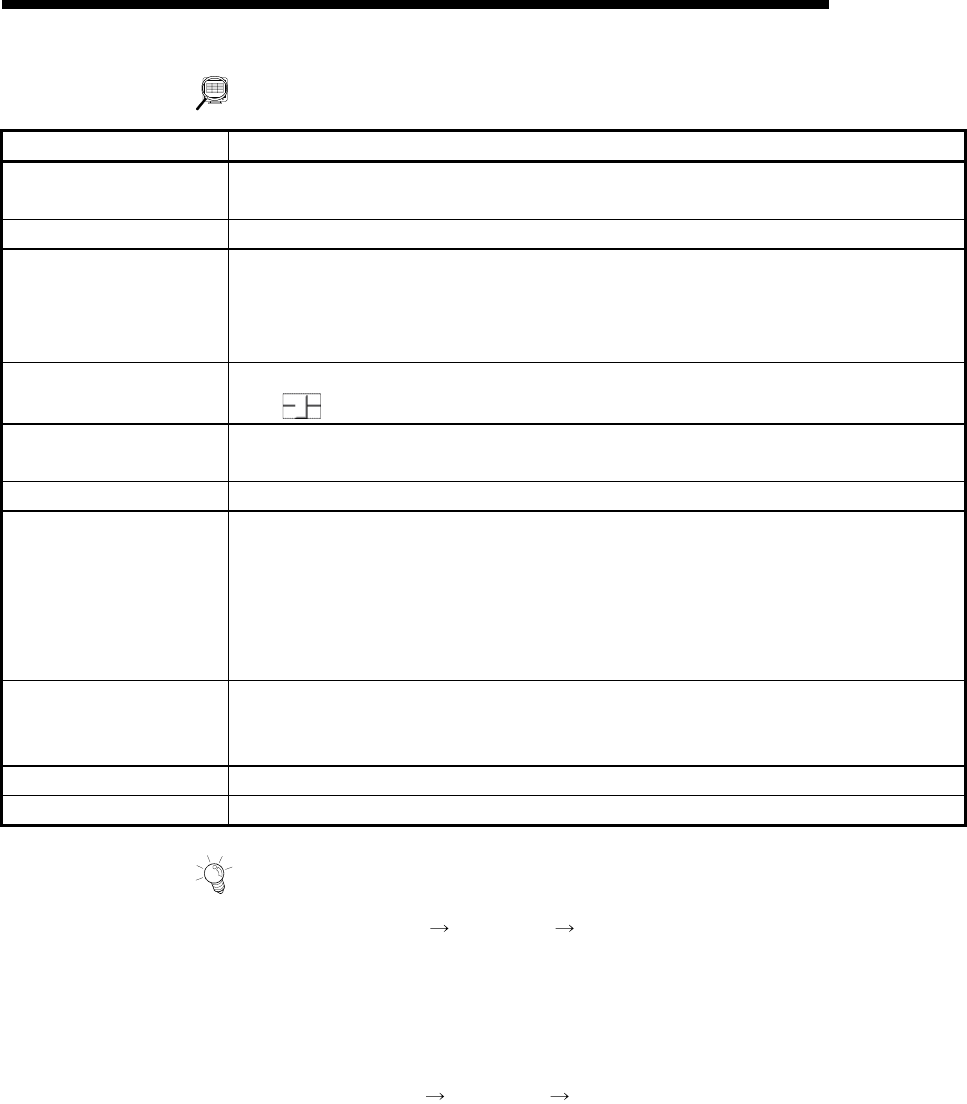
Horizontal
Vertical
Show the display multiplying factor of the waveform data.
Move
to the right to enlarge or to the left to reduce.
Preserve aspect
Check this check box to make the waveform data display multiplying factor equal in the
vertical and horizontal directions.
Trace data Shows the axes and data types set in the Trace setting dialog box.
"Trace" button
Click this button to initialize trace.
On completion of initialization, the "Start" button in the dialog box is made valid.
Clicking the "Start" button gives a trace start request to the QD75P, QD75D and LD75.
If the trigger condition is "No condition", trace starts.
If the trigger condition is other than "No condition", trace actually starts when the trigger
condition holds.
"Stop" button
Click this button to stop trace and show the trace results.
If the stop condition is Buffer full, Error stop or Trace point, clicking the "Stop" button stops
trace and shows the trace results available at that point.
"Default" button Click this button to update the display to the latest trace data.
"Setting" button Click this button to display the Trace condition dialog box.
HELPFUL OPERATION
Clicking the [Project]
[Export file]
[File writing of Trace data] menu saves the
trace data and trace conditions.
To read the trace data file, perform the following operation.
1. In the Select module type dialog box (refer to Section 11.1.2), choose the same
model as the one at the time of write.
2. Display the wave trace window.
3. Click the [Project]
[Import file]
[File reading of Trace data] menu.
4. Click the "OK" button in the on-screen trace data overwrite confirmation dialog
box.
5. Choose the file location and file name in the file opening dialog box and click the
"Open" button to show the saved waveform data and trace conditions.