
User's Manual Part 1

2-32 Monitor Operation and Sensor Activation
Data Views
Pressing the Data Views button on the VitalSense Monitor front panel will
toggle two means by which to view the sensor data: Sensor List and Data
Graph.
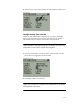
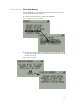
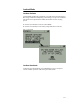
1 On the monitor front panel, press the Data Views button. A list of
sensors will be displayed along with the temperature and time stamp.
(Use the up and down arrows to view sensors which may not be visible
on the display.)
Sensor List Sensor List
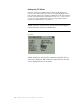
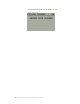
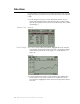
Data Graph 2 To view a sensor in Data Graph mode, highlight the sensor using the
arrow buttons, and press Data Views once more. To adjust the amount
of time shown on the X-axis of the graph, see “ Graph Options ” on
page2-19.
Data Graph
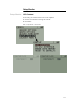
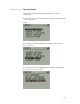
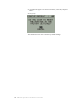
3 You may toggle between Data Graph and Sensor List with the Data
Views button. To view other sensors in Data Graph mode, use the
arrow buttons to highlight the sensor of interest and press Data Views
once more.