
User's Manual Part 1


2-19
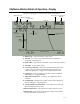
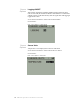
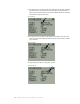
Graph Options
Graph Options
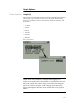
Length (X)
This function sets the length (in hours) of the X-axis displayed in the Data
Views graph. Up to 48 hours of data can be displayed. The following
choices are available. Use the arrow buttons to make the selection, and
press Enter.
• 1.5 hours
• 3 hours
• 6 hours
• 12 hours
• 24 hours
• 48 hours
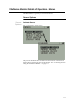
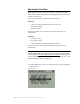
Main > Graph Options
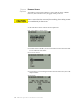
NOTE: When this parameter is changed while logging is in
progress, the graph will be interpolated or extrapolated to the new
time scale, which may result in empty areas when increasing the
time scale. This has no effect on the integrity of the data being
logged, although the data may not be visible until a new graph is
drawn.