
User's Manual Part 1


2-13
VitalSense Monitor Details of Operation - Display
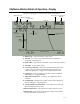
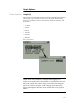
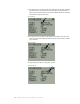
The Data Graph displays a variety of operational characteristics.
1 Display-type - Activation, Menu, or Data View.
2 Asterisk - one or more of the last transmissions was missed. If
reacquired, it will disappear.
3 Sensor label - option chosen or declined as part of activation sequence.
4 Start time - of the logging session.
5 Low battery indicator - battery life remaining will depend on the
number of sensors and the acquisition mode of the monitor. See
“ Battery Replacement ” on page4-4 for additional information.
6 Logging on - monitor is logging sensor data (change from Menu >
Sensor Options > Logging On/Off).
7 Temperature/time curve - a “rolling” curve updated as data are
collected.
8 Graph length - determines the number of hours of data displayed
(change from Main > Graph Options).
9 Y-Scale minimum and maximum - of the temperatures collected
within the displayed time period.
10Sensor temperature - last temperature acquired from any sensor.
11Sensor units - temperature measurement in Celsius or Fahrenheit
(change from Main > Sensor Units).
1-Display-type icon
2-Missed transmission
6-Logging is on
7-Temperature/time
4-Start time
3-Sensor label
8-Graph length (X)
5-Low battery
10-Sensor
9-Max/Min temp
curve
Temperature
indicator
11-Sensor Units