
User's Manual

Mimosa Help Site
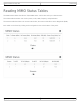
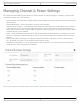
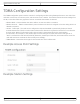
Mimosa Networks Help Site Channel & Power
Copyright © 2015 Mimosa Page 1
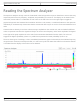
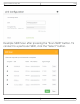
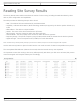
Reading the Spectrum Analyzer
The Spectrum Analyzer actively scans the 5 GHz band in the background to report on interference sources that may
impact link performance by frequency, amplitude, and probability of recurrence. The display can be shown for the
local radio, remote radio or a combination of both. Click on the half circle icon in the upper right to toggle the
graph's background color between black and white. Click the Local, Remote, or Combined buttons to view spectrum
individually or simultaneously. Please note that the remote side data may be as much as 5 minutes behind the local
radio.
Channels that are already in use have “above average” amplitude on the vertical axis, and are shaded in different
colors to represent how often the signals are likely to be on the same frequency at the same amplitude. The legend
to the right of the graph explains the color code for the Cumulative Distribution Function (CDF). The color red
suggests the highest probability (closer to 1), while blue represents the lowest probability (closer to 0).
There are three types of markings, or bars, immediately beneath the graph’s horizontal axis that indicate frequency
ranges that are restricted, manually excluded, or in active use by this link. Note that traffic from the Active Channel
is excluded from the display so that noise can be detected.