
User's Manual
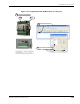
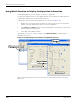
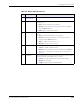
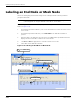
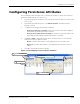
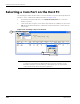
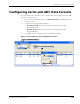
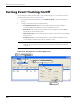
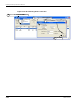
Table Of Contents
- MeshScape™ RK-5424-5 Reference Kit for 2.4 GHz MeshScape Systems User's Guide
- Contents
- About This Guide
- 1: Introduction
- 2: Installing the MeshScape System
- 3: Running MeshScape Network Monitor
- MeshScape Network Monitor Overview
- Configuring a Node’s Operation
- Labeling an End Node or Mesh Node
- Configuring Persistence Attributes
- Selecting a Com Port on the Host PC
- Configuring Serial and ADC Data Formats
- Turning Event Tracking On/Off
- Broadcasting Data to All Nodes.
- Creating an Event Log File
- Viewing the Contents of an Event Log File
- Viewing MeshScape Statistics
- 4: Using the MeshScape API
- A: Running the Demo Application
- B: Using MeshScape Programmer
- Glossary
- Index

3-16 Millennial Net
Running MeshScape Network Monitor
Using Watch Function to Display Configuration Information
Use the Watch window to track changes to a device’s configuration.
You may open multiple instances of the Watch window. The selected device’s ID and label (if
configured) are displayed in the Watch window title bar.
To display the current and desired configuration for a device (see Figure 3-17):
1. Double-click on the desired device from the list of discovered sensor nodes. The Device
window is opened, displaying the device’s current configuration.
2. Select Watch. The Watch window is opened, displaying the selected device’s current and
desired configuration information.
3. Select X to exit the Watch window.
Alternatively, click once on a device and then select Window>Watch to open the Watch
window for that device.
Figure 3-17. Displaying I/O information using Watch function
Table 3-9 describes the functions of the various sections of the Watch window as shown in
Figure 3-17.
Watch window
Select Watch
2
Device window
Double-click on device
1
Select X
3