
User`s guide


5-59Reference
Using the Color Meter Display
The Color Meter Display is useful if you wish to adjust the
shadow and highlight points of an image.
As you pass over a point in the image, the Color Meter
Display will show the appropriate RGB values of that point in
the image. The significance of the numbers is explained
below.
• There are two numbers shown in the Color Meter
Display. The first number represents the raw color data
taken by the scanner; the second number represents the
resulting value after color correction or image enhance-
ment is applied to the image.
• The values can be anywhere from 0 to 255, with 0 as the
black point, 255 as pure white, and all other values in
between corresponding to shades from black to white.
• The values as a whole represent color information for the
sample size selected in the Sample Size button (discussed
below). For instance, if you chose 3 x 3 as your sample
size and your R value reads 23, that shows your red value
of 23 is the average of a 3-pixel by 3-pixel area.
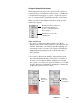
The numbers can
be from 0 to 255,
with 0 as the black
point, 255 as
white, and all
values in between
corresponding to
shades from black
to white.
The first number is
raw color data; the
second number is
color data following
enhancement or
modification.