
User`s guide


MPLAB
®
IDE User’s Guide
DS51519B-page 44 © 2006 Microchip Technology Inc.
Select Debugger>Run to run the application. A text message “Running…” will briefly
appear on the status bar before the application halts at this first breakpoint.
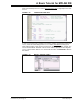
The Watch window should now show that the variable COUNT was incremented by one,
but since the breakpoint is at the line before the move to PORTC executes, PORTC still
has a value of zero.
FIGURE 2-24: WATCH – AT BREAKPOINT
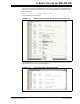
Press the Run icon to execute the code until it hits this point again. The Watch window
should now show both values incremented by one from their previous value.
FIGURE 2-25: WATCH – NEXT BREAKPOINT
This would seem to indicate that the program is working as designed. You can single
step through the code, or run the code more times to verify that it is executing properly.
If you single step into the delay loop, you will get stuck executing thousands of steps
until reaching the end. To exit out of the delay loop, use Debugger>Step Out
.
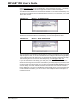
If you are interested in calculating your delay time, the data book could be used to
determine how long each instruction would take in your delay loop and you would come
up with a pretty accurate number. You can also use the MPLAB IDE StopWatch to mea-
sure the delay. Your main interest should be the time each new value of COUNT is
being displayed. If you set your breakpoint as was initially done, on the instruction that
moves COUNT to PORTC, you can run to the next breakpoint at the same place to
measure the time.