
User`s guide


MPLAB
®
IDE User’s Guide
DS51519B-page 38 © 2006 Microchip Technology Inc.
If the code did not assemble and link successfully, check the following items and then
build the project again:
• If the assembler reported errors in the Output window, double click on the error
and MPLAB IDE will open the corresponding line in the source code with a green
arrow in the left margin of the source code window.
• Check the spelling and format of the code entered in the editor window. Make sure
the new variables and the special function registers, TRISC and PORTC, are in
upper case.
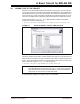
• Check that the correct assembler (MPASM assembler) and linker for PICmicro
MCU devices is being used. Select Project>Set Language Tool Locations
. Click
on the plus boxes to expand the Microchip MPASM toolsuite and its executables.
Click MPASM Assembler (mpasmwin.exe) and review their location in the dis-
play. If the location is correct, click Cancel. If it is not, change it and then click OK.
The default search paths can be empty.
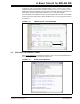
Upon a successful build, the output file generated by the language tool will be loaded.
This file contains the object code that can be programmed into a PICmicro MCU and
debugging information so that source code can be debugged and source variables can
be viewed symbolically in Watch windows.
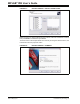
2.12 TESTING CODE WITH THE SIMULATOR
In order to test the code, software or hardware is needed that will execute the PICmicro
MCU instructions. A debug execution tool is a hardware or software tool that is used to
inspect code as it executes a program (in this case cnt8722.asm). Hardware tools
such as MPLAB ICE or MPLAB ICD 2 can execute code in real devices. If hardware is
not available, the MPLAB SIM simulator can be used to test the code. For this tutorial
use MPLAB SIM simulator.
The simulator is a software program that runs on the PC to simulate the instructions of
the PICmicro MCU. It does not run in “real time,” since the simulator program is
dependent upon the speed of the PC, the complexity of the code, overhead from the
operating system and how many other tasks are running. However, the simulator
accurately measures the time it would take to execute the code if it were operating in
real time in an application.
Note: The real power of projects is evident when there are many files to be
compiled/assembled and linked to form the final executable application –
as in a real application. Projects keep track of all of this. Build options can
be set for each file that access other features of the language tools, such
as report outputs and compiler optimizations.
Note: Other debug execution tools include MPLAB ICE 2000, MPLAB ICE 4000
and MPLAB ICD 2. These are optional hardware tools to test code on the
application PC board. Most of the MPLAB IDE debugging operations are
the same as the simulator but, unlike the simulator, these tools allow the
target PICmicro MCU to run at full speed in the actual target application.