
User`s guide


MPLAB
®
IDE User’s Guide
DS51519B-page 128 © 2006 Microchip Technology Inc.
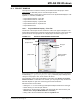
12.3 CODE DISPLAY WINDOW SYMBOLS
In the gutter of some windows, the following symbols may appear:
Current location (line of code) of the program counter. Program execution is halted
(stopped).
Location of the program counter before the program was run. Program is currently
executing (running).
Breakpoint set.
Breakpoint disabled.
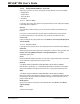
Breakpoint set on an address. This symbol is displayed only in the file (editor)
window, since one line of code could correspond to several addresses. See
Section 3.18 “Using Breakpoints” for more information.
Code coverage enabled for this location (Program Memory window, MPLAB
®
ICE
2000/4000 only).
Complex trigger point set at this location (Program Memory window, MPLAB ICE
2000/4000 only).
Filter in trace (File window). See Section 15.5.1 “Filter Trace” for more information.
Filter out trace (File window). See Section 15.5.1 “Filter Trace” for more
information.