
Datasheet


2001-2013 Microchip Technology Inc. DS35007C-page 59
PIC16F84A
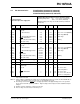
10.0 DC/AC CHARACTERISTIC GRAPHS
The graphs provided in this section are for design guidance and are not tested.
In some graphs, the data presented are outside specified operating range (i.e., outside specified V
DD range). This is
for information only and devices are ensured to operate properly only within the specified range.
The data presented in this section is a statistical summary of data collected on units from different lots over a period
of time and matrix samples. ‘Typical’ represents the mean of the distribution at 25C. ‘Max’ or ‘Min’ represents
(mean + 3) or (mean - 3), respectively, where is a standard deviation over the whole temperature range.