
Datasheet


2002 Microchip Technology Inc. DS30325B-page 141
PIC16F7X
16.0 DC AND AC CHARACTERISTICS GRAPHS AND TABLES
“Typical” represents the mean of the distribution at 25°C. “Maximum” or “minimum” represents (mean + 3σ) or (mean - 3σ)
respectively, where σ is a standard deviation, over the whole temperature range.
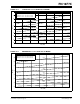
FIGURE 16-1: TYPICAL IDD vs. FOSC OVER VDD (HS MODE)
FIGURE 16-2: MAXIMUM I
DD vs. FOSC OVER VDD (HS MODE)
Note: The graphs and tables provided following this note are a statistical summary based on a limited number of
samples and are provided for informational purposes only. The performance characteristics listed herein are
not tested or guaranteed. In some graphs or tables, the data presented may be outside the specified oper-
ating range (e.g., outside specified power supply range) and therefore, outside the warranted range.
0
1
2
3
4
5
6
4 6 8 10 12 14 16 18 20
F
OSC (MHz)
I
DD
(mA)
5.5V
5.0V
4.5V
4.0V
3.5V
3.0V
2.5V
2.0V
Typical: statistical mean @ 25°C
Maximum: mean + 3
σ (-40°C to 125°C)
Minimum: mean – 3
σ (-40°C to 125°C)
0
1
2
3
4
5
6
7
8
4 6 8 10 12 14 16 18 20
F
OSC
(MHz)
I
DD
(mA)
5.5V
5.0V
4.5V
4.0V
3.5V
3.0V
2.5V
2.0V
Typical: statistical mean @ 25°C
Maximum: mean + 3
σ (-40°C to 125°C)
Minimum: mean – 3
σ (-40°C to 125°C)