
Datasheet


1997-2013 Microchip Technology Inc. DS30234E-page 277
PIC16C6X
Applicable Devices 61 62 62A R62 63 R63 64 64A R64 65 65A R65 66 67
23.0 DC AND AC CHARACTERISTICS GRAPHS AND TABLES FOR:
PIC16C62, PIC16C62A, PIC16CR62, PIC16C63, PIC16C64, PIC16C64A,
PIC16CR64, PIC16C65A, PIC16C66, PIC16C67
The graphs and tables provided in this section are for design guidance and are not tested or guaranteed.
In some graphs or tables the data presented are outside specified operating range (i.e., outside specified V
DD
range). This is for information only and devices are guaranteed to operate properly only within the specified
range.
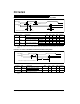
FIGURE 23-1: TYPICAL IPD vs. VDD (WDT DISABLED, RC MODE)
FIGURE 23-2: MAXIMUM I
PD vs. VDD (WDT DISABLED, RC MODE)
Note: The data presented in this section is a statistical summary of data collected on units from different lots over
a period of time and matrix samples. 'Typical' represents the mean of the distribution at, 25C, while 'max'
or 'min' represents (mean +3) and (mean -3) respectively where is standard deviation.
35
30
25
20
15
10
5
0
2.5 3.0 3.5 4.0 4.5 5.0 5.5 6.0
IPD(nA)
VDD(Volts)
IPD(A)
VDD(Volts)
10.000
1.000
0.100
0.010
0.001
2.5 3.0 3.5 4.0 4.5 5.0 5.5 6.0
85C
70C
25C
0C
-40C