
Datasheet


1997-2013 Microchip Technology Inc. DS30234E-page 169
PIC16C6X
Applicable Devices 61 62 62A R62 63 R63 64 64A R64 65 65A R65 66 67
16.0 DC AND AC
CHARACTERISTICS GRAPHS
AND TABLES FOR PIC16C61
The graphs and tables provided in this section are for
design guidance and are not tested or guaranteed.
In some graphs or tables the data presented are
outside specified operating range (i.e., outside
specified V
DD range). This is for information only
and devices are guaranteed to operate properly
only within the specified range.
Note: The data presented in this section is a sta-
tistical summary of data collected on units
from different lots over a period of time and
matrix samples. 'Typical' represents the
mean of the distribution while 'max' or 'min'
represents (mean +3) and (mean -3)
respectively where is standard deviation.
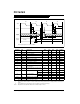
FIGURE 16-1: TYPICAL RC OSCILLATOR FREQUENCY vs. TEMPERATURE
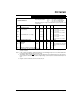
TABLE 16-1: RC OSCILLATOR FREQUENCIES
The percentage variation indicated here is part to part variation due to normal process distribution. The variation indi-
cated is 3 standard deviation from average value for V
DD = 5V.
Cext Rext
Average
Fosc @ 5V, 25C
20 pF 4.7k 4.52 MHz 17.35%
10k 2.47 MHz 10.10%
100k 290.86 kHz 11.90%
100 pF 3.3k 1.92 MHz 9.43%
4.7k 1.48 MHz 9.83%
10k 788.77 kHz 10.92%
100k 88.11 kHz 16.03%
300 pF 3.3k 726.89 kHz 10.97%
4.7k 573.95 kHz 10.14%
10k 307.31 kHz 10.43%
100k 33.82 kHz 11.24%
FOSC
FOSC (25C)
1.050
1.025
1.00
0.975
0.950
0.925
0.900
0.875
010 20253040506070
T (
C)
Frequency Normalized T
O +25C
VDD = 5.5V
VDD = 3.5V
REXT 10 k
CEXT = 100 pF
0.850