
Datasheet


1997-2013 Microchip Technology Inc. Preliminary DS30453E-page 165
PIC16C5X
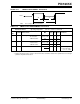
20.0 DEVICE CHARACTERIZATION - PIC16LC54C 40MHz
The graphs and tables provided following this note are a statistical summary based on a limited number of samples and
are provided for informational purposes only. The performance characteristics listed herein are not tested or guaran-
teed. In some graphs or tables, the data presented may be outside the specified operating range (e.g., outside specified
power supply range) and therefore outside the warranted range.
“Typical” represents the mean of the distribution at 25°C. “Maximum” or “minimum” represents (mean + 3) or (mean
– 3) respectively, where is a standard deviation, over the whole temperature range.
FIGURE 20-1: TYPICAL IPD vs. VDD, WATCHDOG DISABLED (25C)
VDD (Volts)
IPD (uA)
25
20
15
5.0
0
2.5 3.0 3.5
4.5
5.5
4.0
5.0
6.0
10
4.0
Typical: statistical mean @ 25°C
Maximum: mean + 3s (-40°C to 125°C)
Minimum: mean – 3s (-40°C to 125°C)