
Datasheet


PIC16C5X
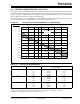
DS30453E-page 94 Preliminary 1997-2013 Microchip Technology Inc.
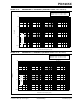
FIGURE 14-6: MAXIMUM IPD vs. VDD,
WATCHDOG DISABLED
FIGURE 14-7: TYPICAL IPD vs. V
DD,
WATCHDOG ENABLED
FIGURE 14-8: MAXIMUM I
PD vs. VDD,
WATCHDOG ENABLED
0
2.5 3.0 3.5 4.0 4.5 5.0 5.5 6.0
Ipd (
A)
V
DD
(Volts)
1
6.5 7.0
10
100
+85°C
0°C
–40°C
–55°C
+125°C
+70°C
Typical: statistical mean @ 25°C
Maximum: mean + 3s (-40°C to 125°C)
Minimum: mean – 3s (-40°C to 125°C)
20
16
12
8
4
0
2.5 3.0 3.5 4.0 4.5 5.0 5.5 6.0
IPD (
A)
VDD (Volts)
2
6
10
14
18
T = 25C
Typical: statistical mean @ 25°C
Maximum: mean + 3s (-40°C to 125°C)
Minimum: mean – 3s (-40°C to 125°C)
+70
C
0
2.5 3.0 3.5 4.0 4.5 5.0 5.5 6.0
I
PD
(
A)
V
DD
(Volts)
6.5 7.0
40
60
+85
C
–40
C
–55
C
10
20
30
50
+125
C
0
C
IPD, with WDT enabled, has two components:
The leakage current, which increases with higher temper-
ature, and the operating current of the WDT logic, which
increases with lower temperature. At –40C, the latter
dominates explaining the apparently anomalous behav-
ior.
Typical: statistical mean @ 25°C
Maximum: mean + 3s (-40°C to 125°C)
Minimum: mean – 3s (-40°C to 125°C)