
Datasheet


MCP73113/4
DS20002183E-page 10 2009-2013 Microchip Technology Inc.
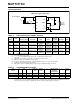
TYPICAL PERFORMANCE CURVES (CONTINUED)
Note: Unless otherwise indicated, V
DD
= [V
REG
(Typical) + 1V], I
OUT
= 10 mA and T
A
= +25°C, Constant-Voltage mode.
FIGURE 2-7: Charge Current (I
OUT
) vs.
Programming Resistor (R
PROG
).
FIGURE 2-8: Charge Current (I
OUT
) vs.
Programming Resistor (R
PROG
).
FIGURE 2-9: Charge Current (I
OUT
) vs.
Programming Resistor (R
PROG
).
FIGURE 2-10: Charge Current (I
OUT
) vs.
Programming Resistor (R
PROG
).
FIGURE 2-11: Charge Current (I
OUT
) vs.
Ambient Temperature (T
A
).
FIGURE 2-12: Output Leakage Current
(I
DISCHARGE
) vs. Ambient Temperature (T
A
).
475
495
515
535
555
575
595
615
635
655
675
4.5 4.8 5.1 5.4 5.7 6.0
Supply Voltage (V)
Charge Current (mA)
R
PRO G
= 2 kΩ
T
A
= +25
°C
150
170
190
210
230
250
270
290
310
330
350
4.5 4.8 5.1 5.4 5.7 6.0
Supply Voltage (V)
Charge Current (mA)
R
PROG
= 5 kΩ
T
A
= +25
°C
90
96
102
108
114
120
126
132
138
144
150
4.5 4.8 5.1 5.4 5.7 6.0
Supply Voltage (V)
Fast Charge (mA)
R
PROG
= 10 kΩ
T
A
= +25°C
50
53
56
59
62
65
68
71
74
77
80
4.54.85.15.45.76.0
Supply Voltage (V)
Charge Curent (mA)
R
PROG
= 20 kΩ
T
A
= +25°C
750
770
790
810
830
850
870
890
910
930
950
-5 5 1525354555
Ambient Temperature (°C)
Charge Current (mA)
R
PROG
= 1.33 kΩ
V
DD
= 5.2V
-1.0
0.0
1.0
2.0
3.0
4.0
5.0
6.0
7.0
8.0
9.0
-5.0 5.0 15.0 25.0 35.0 45.0 55.0
Ambient Temperature (°C)
Discharge Current (uA)
V
DD
< V
BAT
V
DD
< V
STOP
End of Charge