
Datasheet


Table Of Contents
- Package Types
- Typical Application
- 1.0 Electrical Characteristics
- 2.0 Typical Performance Curves
- Figure 2-1: Input Offset Voltage
- Figure 2-2: Input Offset Voltage Drift
- Figure 2-3: Input Offset Voltage vs. Common Mode Input Voltage
- Figure 2-4: Input Offset Voltage vs. Common Mode Input Voltage
- Figure 2-5: Input Offset Voltage vs. Output Voltage
- Figure 2-6: Input Offset Voltage vs. Power Supply Voltage
- FIGURE 2-7: Input Noise Voltage Density vs. Frequency.
- FIGURE 2-8: Input Noise Voltage Density vs. Common Mode Input Voltage.
- FIGURE 2-9: CMRR, PSRR vs. Frequency.
- FIGURE 2-10: CMRR, PSRR vs. Ambient Temperature.
- FIGURE 2-11: Input Bias, Offset Currents vs. Ambient Temperature.
- FIGURE 2-12: Input Bias Current vs. Common Mode Input Voltage.
- FIGURE 2-13: Quiescent Current vs. Ambient Temperature.
- FIGURE 2-14: Quiescent Current vs. Common Mode Input Voltage.
- FIGURE 2-15: Quiescent Current vs. Common Mode Input Voltage.
- FIGURE 2-16: Quiescent Current vs. Power Supply Voltage.
- FIGURE 2-17: Open-Loop Gain, Phase vs. Frequency.
- FIGURE 2-18: DC Open-Loop Gain vs. Ambient Temperature.
- FIGURE 2-19: Gain Bandwidth Product, Phase Margin vs. Ambient Temperature.
- FIGURE 2-20: Gain Bandwidth Product, Phase Margin vs. Ambient Temperature.
- FIGURE 2-21: Output Short Circuit Current vs. Power Supply Voltage.
- FIGURE 2-22: Output Voltage Swing vs. Frequency.
- FIGURE 2-23: Output Voltage Headroom vs. Output Current.
- FIGURE 2-24: Output Voltage Headroom vs. Output Current.
- FIGURE 2-25: Output Voltage Headroom vs. Ambient Temperature.
- FIGURE 2-26: Output Voltage Headroom vs. Ambient Temperature.
- FIGURE 2-27: Slew Rate vs. Ambient Temperature.
- FIGURE 2-28: Small Signal Non-Inverting Pulse Response.
- FIGURE 2-29: Small Signal Inverting Pulse Response.
- FIGURE 2-30: Large Signal Non-Inverting Pulse Response.
- FIGURE 2-31: Large Signal Inverting Pulse Response.
- FIGURE 2-32: The MCP6491/2/4 Shows No Phase Reversal.
- FIGURE 2-33: Closed Loop Output Impedance vs. Frequency.
- FIGURE 2-34: Measured Input Current vs. Input Voltage (below VSS).
- FIGURE 2-35: Channel-to-Channel Separation vs. Frequency (MCP6492/4 only).
- 3.0 Pin Descriptions
- 4.0 Application Information
- 5.0 Design Aids
- 6.0 Packaging Information
- Appendix A: Revision History
- Product Identification System
- Trademarks
- Worldwide Sales and Service
2012-2013 Microchip Technology Inc. DS20002321C-page 3
MCP6491/2/4
1.0 ELECTRICAL
CHARACTERISTICS
1.1 Absolute Maximum Ratings †
V
DD
–V
SS
................................................................................................................................... ......................................................6.5V
Current at Input Pins ................................................................................................................ ......................................................±2 mA
Analog Inputs (V
IN
+, V
IN
-) (Note 1) .................................................................................................................V
SS
– 1.0V to V
DD
+1.0V
All Other Inputs and Outputs ...........................................................................................................................V
SS
– 0.3V to V
DD
+0.3V
Difference Input Voltage...........................................................................................................................................................V
DD
–V
SS
Output Short-Circuit Current ...................................................................................................................................................continuous
Current at Output and Supply Pins .............................................................................................................................................±60 mA
Storage Temperature ................................................................................................................ .....................................-65°C to +150°C
Maximum Junction Temperature (T
J
)................................................................................................................ ...........................+150°C
ESD protection on all pins (HBM) 4kV
Note 1: See Section 4.1.2, Input Voltage Limits.
† Notice: Stresses above those listed under “Absolute Maximum Ratings” may cause permanent damage to the device.
This is a stress rating only and functional operation of the device at those or any other conditions above those indicated
in the operational listings of this specification is not implied. Exposure to maximum rating conditions for extended
periods may affect device reliability.
1.2 Specifications
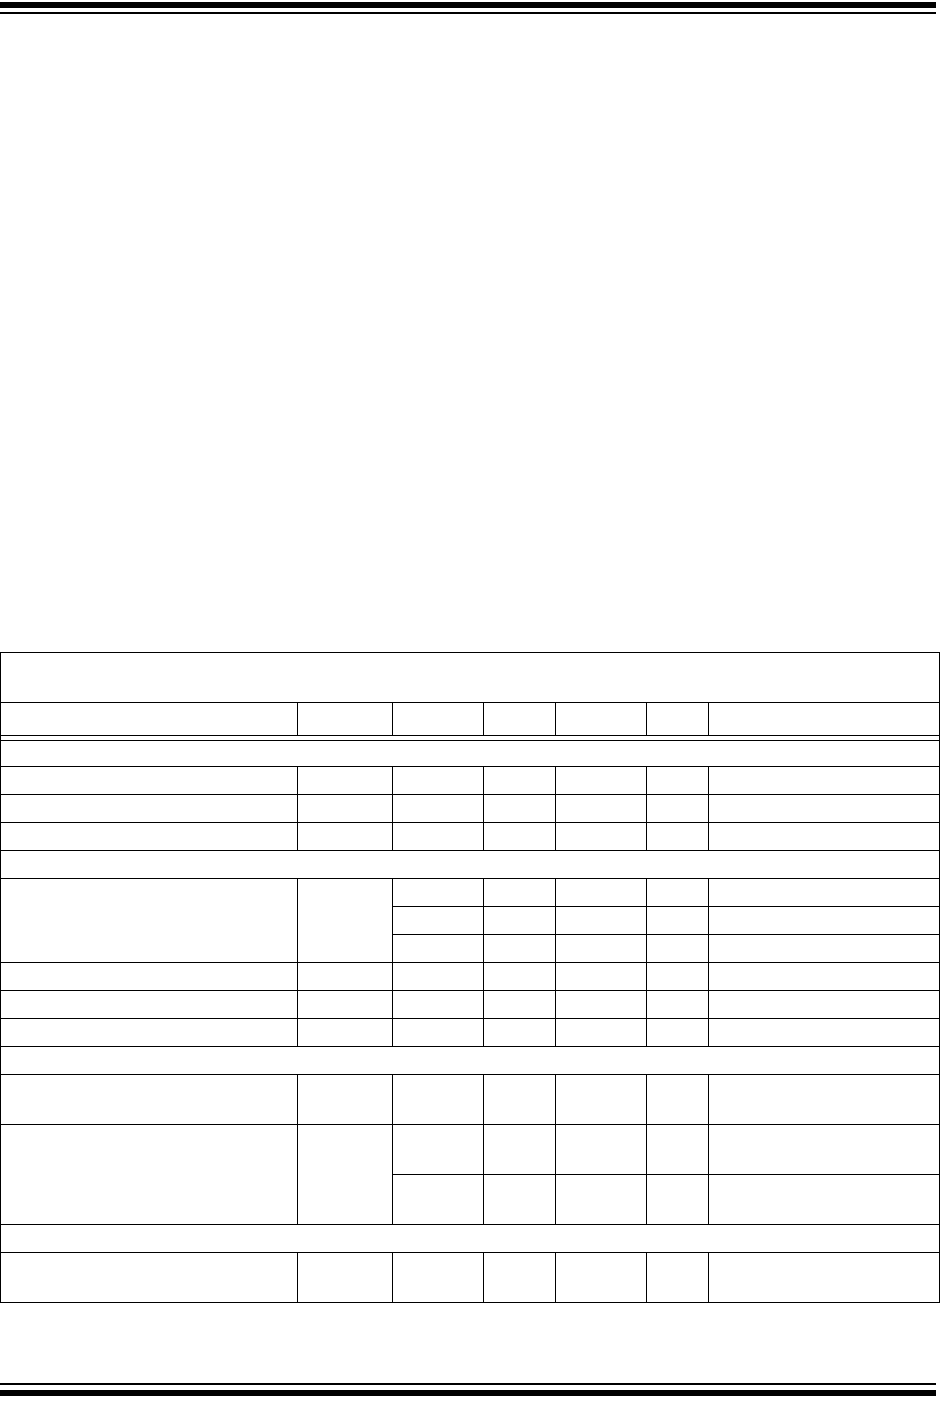
TABLE 1-1: DC ELECTRICAL SPECIFICATIONS
Electrical Characteristics: Unless otherwise indicated, V
DD
= +2.4V to +5.5V, V
SS
= GND, T
A
= +25°C,
V
CM
=V
DD
/2, V
OUT
V
DD
/2, V
L
=V
DD
/2 and R
L
=10kto V
L
. (Refer to Figure 1-1).
Parameters Sym Min Typ Max Units Conditions
Input Offset
Input Offset Voltage V
OS
-1.5 — +1.5 mV V
DD
= 3.0V, V
CM
=V
DD
/4
Input Offset Drift with Temperature V
OS
/T
A
—±2.5—µV/°CT
A
= -40°C to +125°C
Power Supply Rejection Ratio PSRR 75 90 — dB V
CM
=V
DD
/4
Input Bias Current and Impedance
Input Bias Current I
B
—±1—pA
—8—pAT
A
=+85°C
—150350pAT
A
= +125°C
Input Offset Current I
OS
—±0.1—pA
Common Mode Input Impedance Z
CM
—10
13
||6 — ||pF
Differential Input Impedance Z
DIFF
—10
13
||6 — ||pF
Common Mode
Common Mode Input Voltage
Range
V
CMR
V
SS
-0.3 — V
DD
+0.3 V
Common Mode Rejection Ratio CMRR 65 84 — dB V
CM
= -0.3V to 2.7V,
V
DD
=2.4V
70 88 — dB V
CM
= -0.3V to 5.8V,
V
DD
=5.5V
Open-Loop Gain
DC Open-Loop Gain (Large Signal) A
OL
95 115 — dB 0.2V < V
OUT
<(V
DD
–0.2V)
V
DD
= 5.5V, V
CM
=V
SS