
User manual

MCP355X Sensor Application Developer’s Board User’s Guide
DS51609A-page 18 © 2006 Microchip Technology Inc.
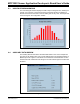
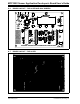
4.3 NOISE HISTOGRAM WINDOW
The noise histogram window displays the ADC output in histogram form, building the
number of occurrences in each bin with each consecutive sample. The difference
between each bin from the mean in units of LSB is given as the y-axis. The sample size
can be changed in the configuration window.
FIGURE 4-2: Noise Histogram Window.
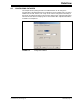
4.4 AUXILIARY DATA WINDOW
The auxiliary data window shows calculated data based on the current sample size.
The mean of the sample set is given in both LSB and PPM. The standard deviation or
RMS output noise is given in units PPM. The overflow bits of the MCP3551 are also
monitored and the overflow bits are also given for both overflow high and overflow low
situations.
FIGURE 4-3: Noise Histogram Window.