
Datasheet


2013 Microchip Technology Inc. DS22331A-page 51
MCP19111
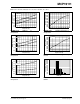
7.0 TYPICAL PERFORMANCE CURVES
Note: Unless otherwise indicated, V
IN
= 12V, F
SW
= 300 kHz, T
A
= +25°C.
FIGURE 7-1: I
Q
vs. Temperature.
FIGURE 7-2: OVCCON DAC INL vs.
Code and Temperature (-40°C to +125°C).
FIGURE 7-3: OVCCON DAC DNL vs.
Code and Temperature (-40°C to +125°C).
FIGURE 7-4: OVFCON DAC INL vs.
Code and Temperature (-40°C to +125°C).
FIGURE 7-5: OVFCON DAC DNL vs.
Code and Temperature (-40°C to +125°C).
FIGURE 7-6: V
DD
vs. Input Voltage.
Note: The graphs and tables provided following this note are a statistical summary based on a limited number of
samples and are provided for informational purposes only. The performance characteristics listed herein
are not tested or guaranteed. In some graphs or tables, the data presented may be outside the specified
operating range (e.g., outside specified power supply range) and therefore, outside the warranted range.
4.8
5.0
5.2
5.4
5.6
c
ent Current (mA)
4.2
4.4
4.6
-40 -25 -10 5 20 35 50 65 80 95 110 125
Quies
c
Temperature (ºC)
-0.6
-0.4
-0.2
0.0
0.2
INL (LSB)
-1.2
-1.0
-0.8
0 64 128 192 256
CODE
0.015
0.020
0.025
0.030
DNL (LSB)
0.005
0.010
0 64 128 192 256
CODE
-0.2
0.0
0.2
0.4
0.6
0.8
1.0
INL (LSB)
-1.0
-0.8
-0.6
-0.4
02468101214161820222426283032
CODE
0.0006
0.0008
0.0010
0.0012
0.0014
0.0016
DNL (LSB)
0.0000
0.0002
0.0004
0 2 4 6 8 10 12 14 16 18 20 22 24 26 28 30 32
CODE
5.06
5.07
5.08
5.09
V
DD
(V)
-40ºC
+125ºC
I
DD
= 1 mA
5.04
5.05
6 8 10 12 14 16 18 20 22 24 26 28 30 32
Input Voltage, V
IN
(V)
+25ºC