
User manual


Atmel-ICE [USER GUIDE]
42330A-MCU-07/2014
19
4. On-Chip Debugging
4.1 Introduction to On-Chip Debugging (OCD)
A traditional Emulator is a tool which tries to imitate the exact behaviour of a target device. The closer this
behaviour is to the actual device’s behaviour, the better the emulation will be.
The Atmel-ICE is not a traditional Emulator. Instead, the Atmel-ICE interfaces with the internal On-Chip Debug
system inside the target device, providing a mechanism for monitoring and controlling its execution. In this way
the application being debugged is not emulated, but actually executed on the real target device.
With an OCD system, the application can be executed whilst maintaining exact electrical and timing
characteristics in the target system – something not technically realisable with a traditional emulator.
Run Mode
When in Run mode, the execution of code is completely independent of the Atmel-ICE. The Atmel-ICE will
continuously monitor the target device to see if a break condition has occurred. When this happens the OCD
system will interrogate the device through its debug interface, allowing the user to view the internal state of the
device.
Stopped Mode
When a breakpoint is reached, program execution is halted, but all I/O will continue to run as if no breakpoint
had occurred. For example assume that a USART transmit has just been initiated when a breakpoint is
reached. In this case the USART continues to run at full speed completing the transmission, even though the
core is in stopped mode.
Hardware Breakpoints
The target OCD module contains a number of program counter comparators implemented in hardware. When
the program counter matches the value stored in one of the comparator registers, the OCD enters stopped
mode. Since hardware breakpoints require dedicated hardware on the OCD module, the number of breakpoints
available depends upon the size of the OCD module implemented on the target. Usually one such hardware
comparator is ‘reserved’ by the debugger for internal use. For more information on the hardware breakpoints
available in the various OCD modules, see “Atmel OCD Implementations” on page 23 .
Software Breakpoints
A software breakpoint is a BREAK instruction placed in program memory on the target device. When this
instruction is loaded, program execution will break and the OCD enters stopped mode. To continue execution
a "start" command has to be given from the OCD. Not all AVR devices have OCD modules supporting the
BREAK instruction. For more information on the software breakpoints available in the various OCD modules,
see “Atmel OCD Implementations” on page 23.
For further information on the considerations and restrictions when using an OCD system, see “Special
Considerations” on page 32.
4.2 Physical Interfaces
The Atmel-ICE supports several hardware interfaces as described in the following sections.
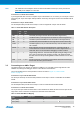
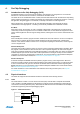
4.2.1 JTAG
The JTAG interface consists of a 4-wire Test Access Port (TAP) controller that is compliant with the IEEE
1149.1 standard. The IEEE standard was developed to provide an industry-standard way to efficiently test
circuit board connectivity (Boundary Scan). Atmel AVR and SAM devices have extended this functionality to
include full Programming and On-Chip Debugging support.
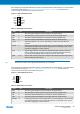
Figure 4-1. JTAG Interface Basics
Atmel
target device
Atmel-ICE
Vcc
TMS
TDI
TDO
TCK