
Specifications


Table Of Contents
- Content
- Welcome!
- Warranty
- 1. Getting Started
- 2. Software Configuration
- 3. Data Capturing
- 3.1. Open Files
- 3.2. Replay of Files
- 3.3. Editing Video Sequences
- 3.4. Saving Files
- 3.4.1. Setting the Recording Frame Rate
- 3.4.2. Setting the Recording Modes
- 3.4.3. Temporary Recording File
- 3.4.4. Saving Radiometric Video Sequences or AVI Files
- 3.4.5. Saving Image Data as Radiometric Snapshot or Text File
- 3.4.6. Saving Text File of the Temperature / Time Diagram
- 3.4.7. Location and Filename Templates of Triggered Recordings
- 3.4.8. Display of Snapshots in a Separate Window
- 3.4.9. Saving Images or Screenshots to Clipboard
- 4. Data Processing
- 5. Visual Camera (TIM200 only)
- Linescanner Mode
- 7. Further Information
thermoIMAGER TIM 63
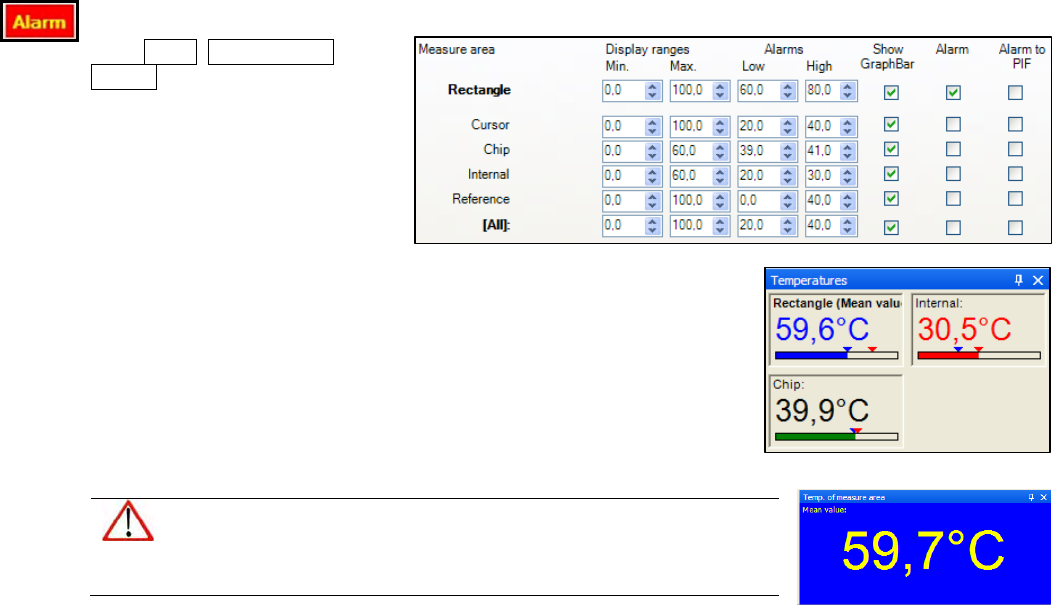
4.8. Alarms
In the Tools, Configuration and
Alarms menu you can define an
alarm for each configured measure
area as well as for the predefined
values (please also see 2.2.4).
The alarm values can be displayed as figures in
the di
gital display or in a
graphical way as a bar. For the latter you need to activate the option Show
Graph Bar. Regarding the bar you can define via Display ranges the Min.
and Max. value (temperature borders). With Alarms the Low and High
thresholds can be set which finally defines the displayed color.
If the high alarm value is reached or exceeded the color of bar changes to
red. If the measured temperature reaches or goes below the lower alarm
value the color of bar changes to blue. Temperatures in between the
defined thresholds are displayed green.
Note
If the alarm value is reached the digit/bar color will change from green
to red (high alarm) or blue (low alarm).