
Specifications


Table Of Contents
- Content
- Welcome!
- Warranty
- 1. Getting Started
- 2. Software Configuration
- 3. Data Capturing
- 3.1. Open Files
- 3.2. Replay of Files
- 3.3. Editing Video Sequences
- 3.4. Saving Files
- 3.4.1. Setting the Recording Frame Rate
- 3.4.2. Setting the Recording Modes
- 3.4.3. Temporary Recording File
- 3.4.4. Saving Radiometric Video Sequences or AVI Files
- 3.4.5. Saving Image Data as Radiometric Snapshot or Text File
- 3.4.6. Saving Text File of the Temperature / Time Diagram
- 3.4.7. Location and Filename Templates of Triggered Recordings
- 3.4.8. Display of Snapshots in a Separate Window
- 3.4.9. Saving Images or Screenshots to Clipboard
- 4. Data Processing
- 5. Visual Camera (TIM200 only)
- Linescanner Mode
- 7. Further Information
thermoIMAGER TIM 58
10
Zoom (decrease) into the diagram. The time axis will remain.
11
Whole range: Display of whole temperature range which is set in the camera.
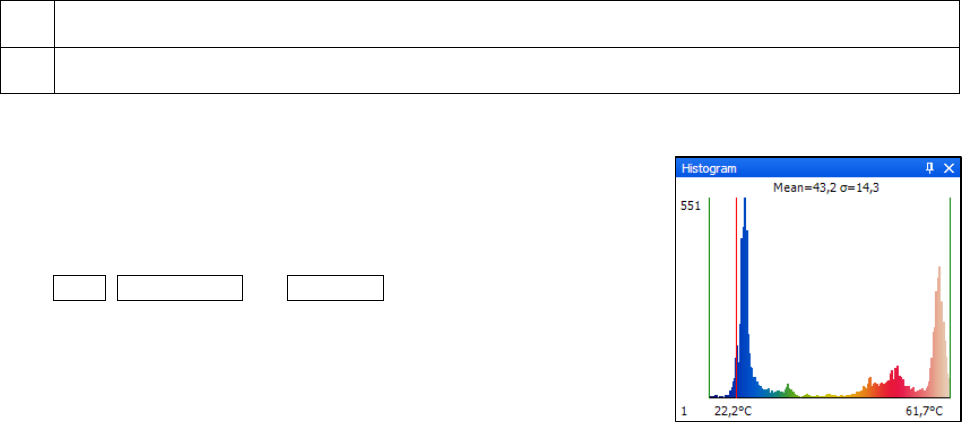
4.4. Histogram
The Histogram feature shows the distribution of pixel intensity values within
a thermal image. The X-axis of the histogram represents the pixel intensity
and the Y-axis represents the percent of color count for each pixel intensity
value.
In the Tools, Configuration and Histogram menu you can adjust various
settings. The given Temperature range and Quantity range can be
generated by the software or by the user by defining the
minimum/maximum temperature value respectively minimum/maximum
quantity.