
Specifications


Table Of Contents
- Content
- Welcome!
- Warranty
- 1. Getting Started
- 2. Software Configuration
- 3. Data Capturing
- 3.1. Open Files
- 3.2. Replay of Files
- 3.3. Editing Video Sequences
- 3.4. Saving Files
- 3.4.1. Setting the Recording Frame Rate
- 3.4.2. Setting the Recording Modes
- 3.4.3. Temporary Recording File
- 3.4.4. Saving Radiometric Video Sequences or AVI Files
- 3.4.5. Saving Image Data as Radiometric Snapshot or Text File
- 3.4.6. Saving Text File of the Temperature / Time Diagram
- 3.4.7. Location and Filename Templates of Triggered Recordings
- 3.4.8. Display of Snapshots in a Separate Window
- 3.4.9. Saving Images or Screenshots to Clipboard
- 4. Data Processing
- 5. Visual Camera (TIM200 only)
- Linescanner Mode
- 7. Further Information
thermoIMAGER TIM 55
4.3. Temperature Time Diagram
4.3.1. General Settings
In the Tools, Configuration and Temp/Time Diagram
menu you can display the temperature over time for
each configured measure area as well as for
predefined values (please also see 2.2.4).
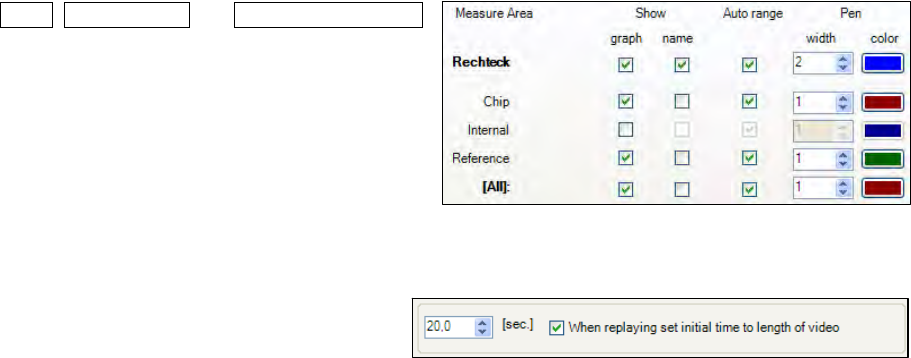
The Show opti
ons defi
ne if a certain temperature value
is displayed or not. If the Graph is shown you can
decide whether to illustrate the Name or not.
If activating the option Auto range the respective
graph is influencing the auto ranging of the diagram. If
the option is not chosen the scaling is based on the other temperature values.
In the menu Pen, the Width of the graph as well as its Color can be individually configured.
A further option is to define the time scaling of the
diagram at a minimum [sec.]. If activating When
replaying set initial time to length of video the
time scaling is adjusted to the length of the stored video sequence loaded into the software.